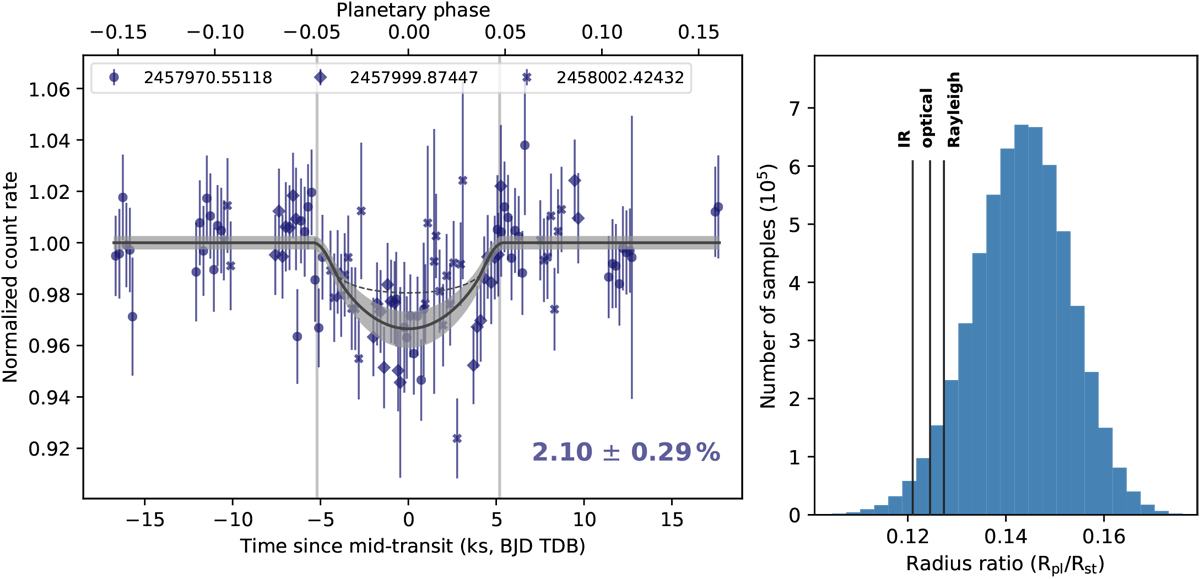
Fig. 2

Left panel: phased light curves of WASP-121 during three transits observed with Swift UVOT labeled by their mid-transit times in BJD. The data are rebinned to 200 s intervals and corrected for the modeled systematic offsets. The uncorrected data are shown in Fig. A.1. The transit model with 1σ uncertaintyinterval of the out-of-transit flux level and transit depth is shown. The optical transit depth is depicted bythe dashed line (B-filter, Delrez et al. 2016). The observed transit depth is given at the bottom with 1σ error. Right panel: posterior of the radius ratio. Optical and IR values are indicated (Delrez et al. 2016; Evans et al. 2016)together with the expected NUV transit depth according to Rayleigh scattering.
Current usage metrics show cumulative count of Article Views (full-text article views including HTML views, PDF and ePub downloads, according to the available data) and Abstracts Views on Vision4Press platform.
Data correspond to usage on the plateform after 2015. The current usage metrics is available 48-96 hours after online publication and is updated daily on week days.
Initial download of the metrics may take a while.


