Fig. 1
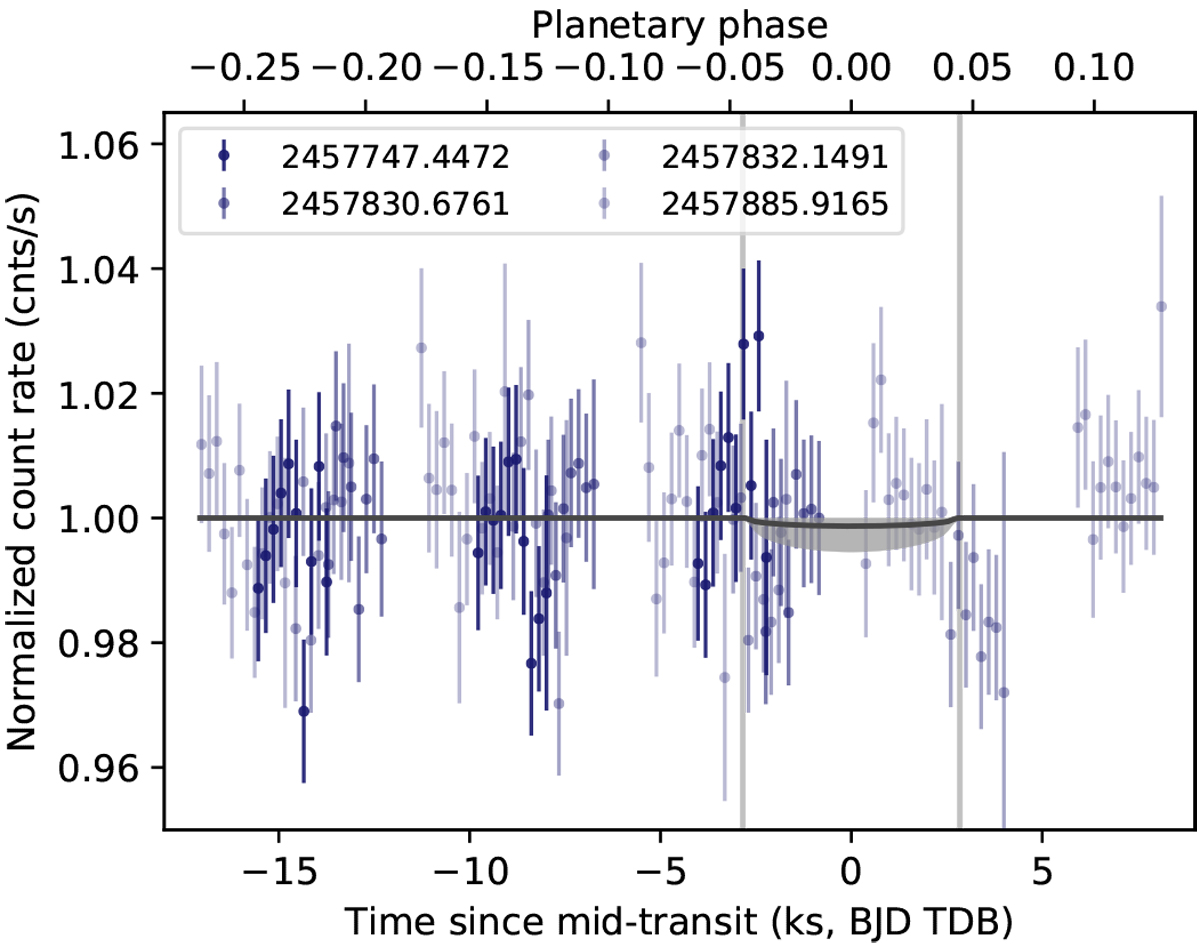
Swift UVOT transit light curves of 55 Cnc e binned to 200 s. Individual visits are color coded; mid-transit times are given in the legend. The planetary transit is marked by vertical lines. The best fit Mandel–Agol transit model (black line) is shown with the 95% confidence region (gray shaded area): a planetary transit is not detected. The four light curves visualize thestability of Swift’s UVOT.
Current usage metrics show cumulative count of Article Views (full-text article views including HTML views, PDF and ePub downloads, according to the available data) and Abstracts Views on Vision4Press platform.
Data correspond to usage on the plateform after 2015. The current usage metrics is available 48-96 hours after online publication and is updated daily on week days.
Initial download of the metrics may take a while.