Fig. 6.
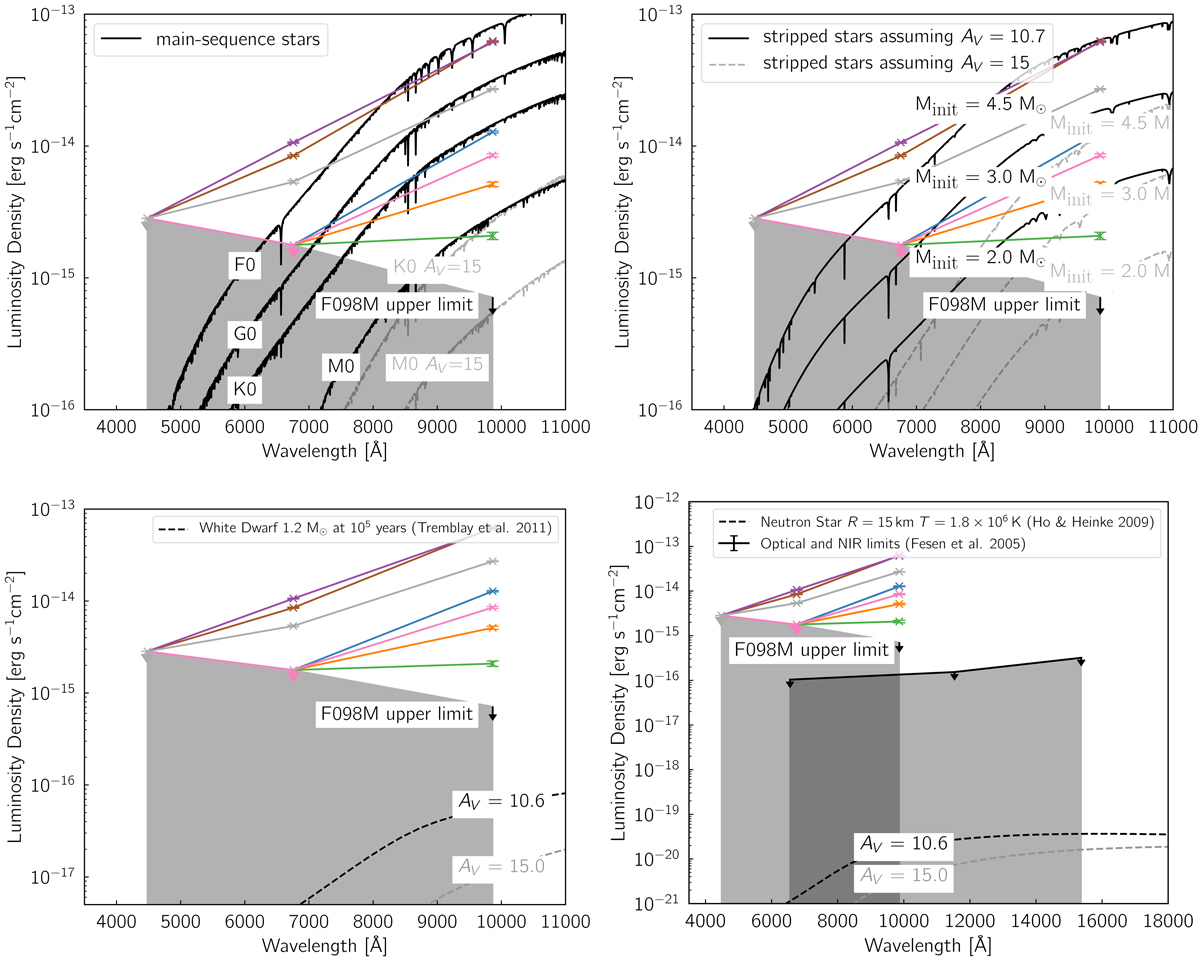
SEDs of the candidates (using the same colors as in Figs. 3 and 4) constructed from the photometry measured from all three observations including upper limits. The gray shaded regions are below the detection limit of the presented photometry. This is the only area where a surviving star would not be detected from this analysis. Upper left panel: synthetic SEDs (default extinction estimate in black; extreme extinction in gray) using temperatures and radii of main-sequence stars using the given the distance and extinction to Cas A compared to the measured SEDs of companion candidates (in color). Upper right panel: synthetic SEDs (default extinction estimate in black; extreme extinction in gray) of stripped stars of 0.3 up to 1.0 M⊙, corresponding to initial masses 2 up to 4.5 M⊙ using the given the distance and extinction of Cas A compared with the measured SEDs of companion candidates (in color). Lower left panel: synthetic SEDs (default extinction estimate in black; extreme extinction in gray) for a 1.2 M⊙ white dwarf at 100 000 years post explosion given the distance and extinction of Cas A compared with the measured SEDs of companion candidates (in color). Lower right panel: neutron star SED (default extinction estimate in black; extreme extinction in gray) using the parameters from Ho & Heinke (2009) and using the given the distance and extinction of Cas A compared with the measured SEDs of companion candidates (in color).
Current usage metrics show cumulative count of Article Views (full-text article views including HTML views, PDF and ePub downloads, according to the available data) and Abstracts Views on Vision4Press platform.
Data correspond to usage on the plateform after 2015. The current usage metrics is available 48-96 hours after online publication and is updated daily on week days.
Initial download of the metrics may take a while.