Fig. 4.
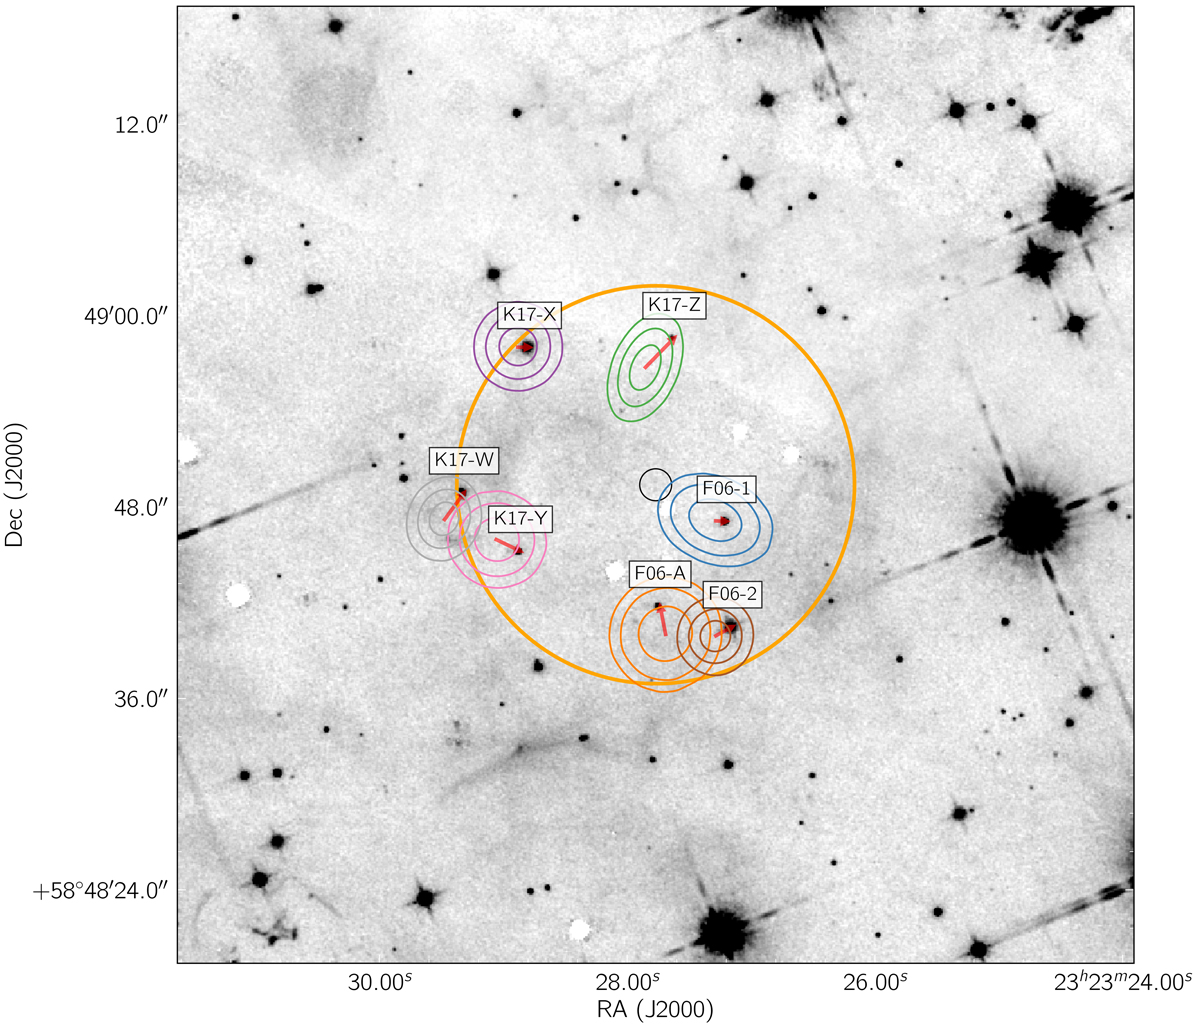
HST F098M image (epoch 2010-10-29) showing the probabilities for the positions of the candidates in 1680. The center of expansion (including the uncertainty of 1″) is depicted as a black circle. The search radius of 600 km s−1 around the center of expansion is shown in orange. The contours show 68%, 95%, and 99.7% confidence intervals (using the same colors as in Fig. 1). A red arrow marks the movement since 1680 to their current position.
Current usage metrics show cumulative count of Article Views (full-text article views including HTML views, PDF and ePub downloads, according to the available data) and Abstracts Views on Vision4Press platform.
Data correspond to usage on the plateform after 2015. The current usage metrics is available 48-96 hours after online publication and is updated daily on week days.
Initial download of the metrics may take a while.