Fig. 7.
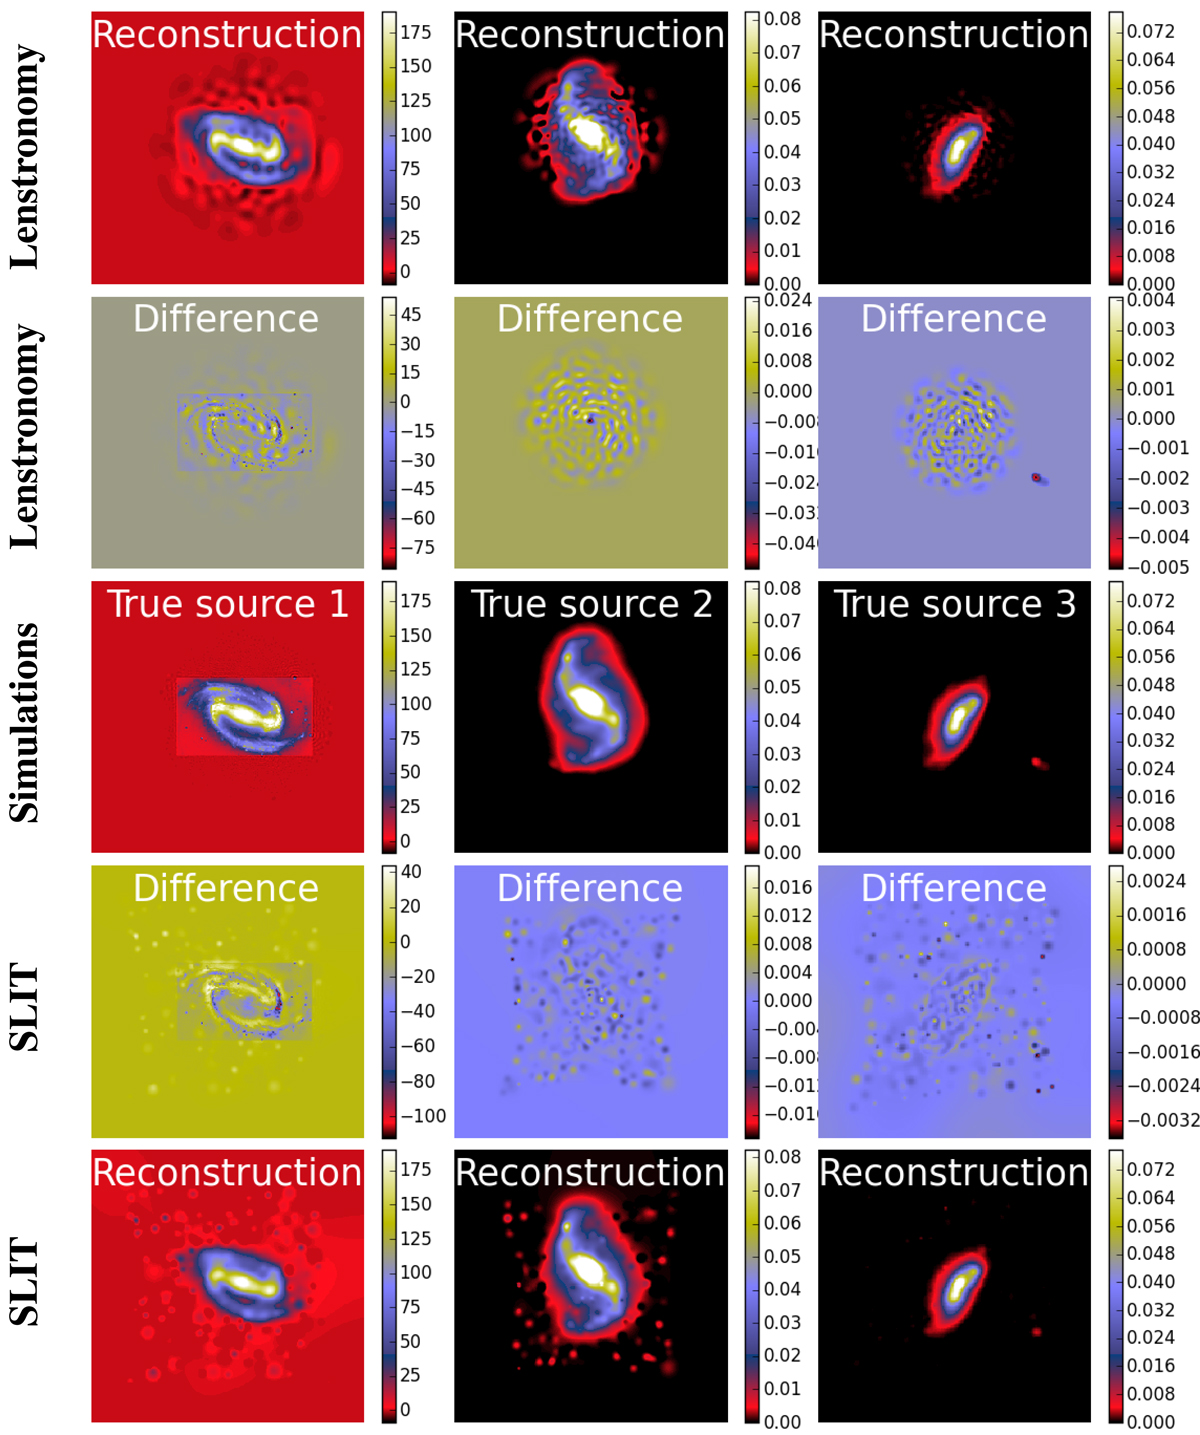
Reconstructions with Lenstronomy and SLIT in the source plane. Panels from the middle row show the true sources used to generate simulated images 1, 2 and 3, respectively. First row: source reconstruction from lenstronomy. Second row: difference between the true sources and the sources reconstructed by lenstronomy. Last row: source reconstruction from SLIT. Penultimate row: difference between true sources and sources reconstructed with SLIT. Panels between reconstructed and true images show the difference between the two for the corresponding technique.
Current usage metrics show cumulative count of Article Views (full-text article views including HTML views, PDF and ePub downloads, according to the available data) and Abstracts Views on Vision4Press platform.
Data correspond to usage on the plateform after 2015. The current usage metrics is available 48-96 hours after online publication and is updated daily on week days.
Initial download of the metrics may take a while.