Fig. 5.
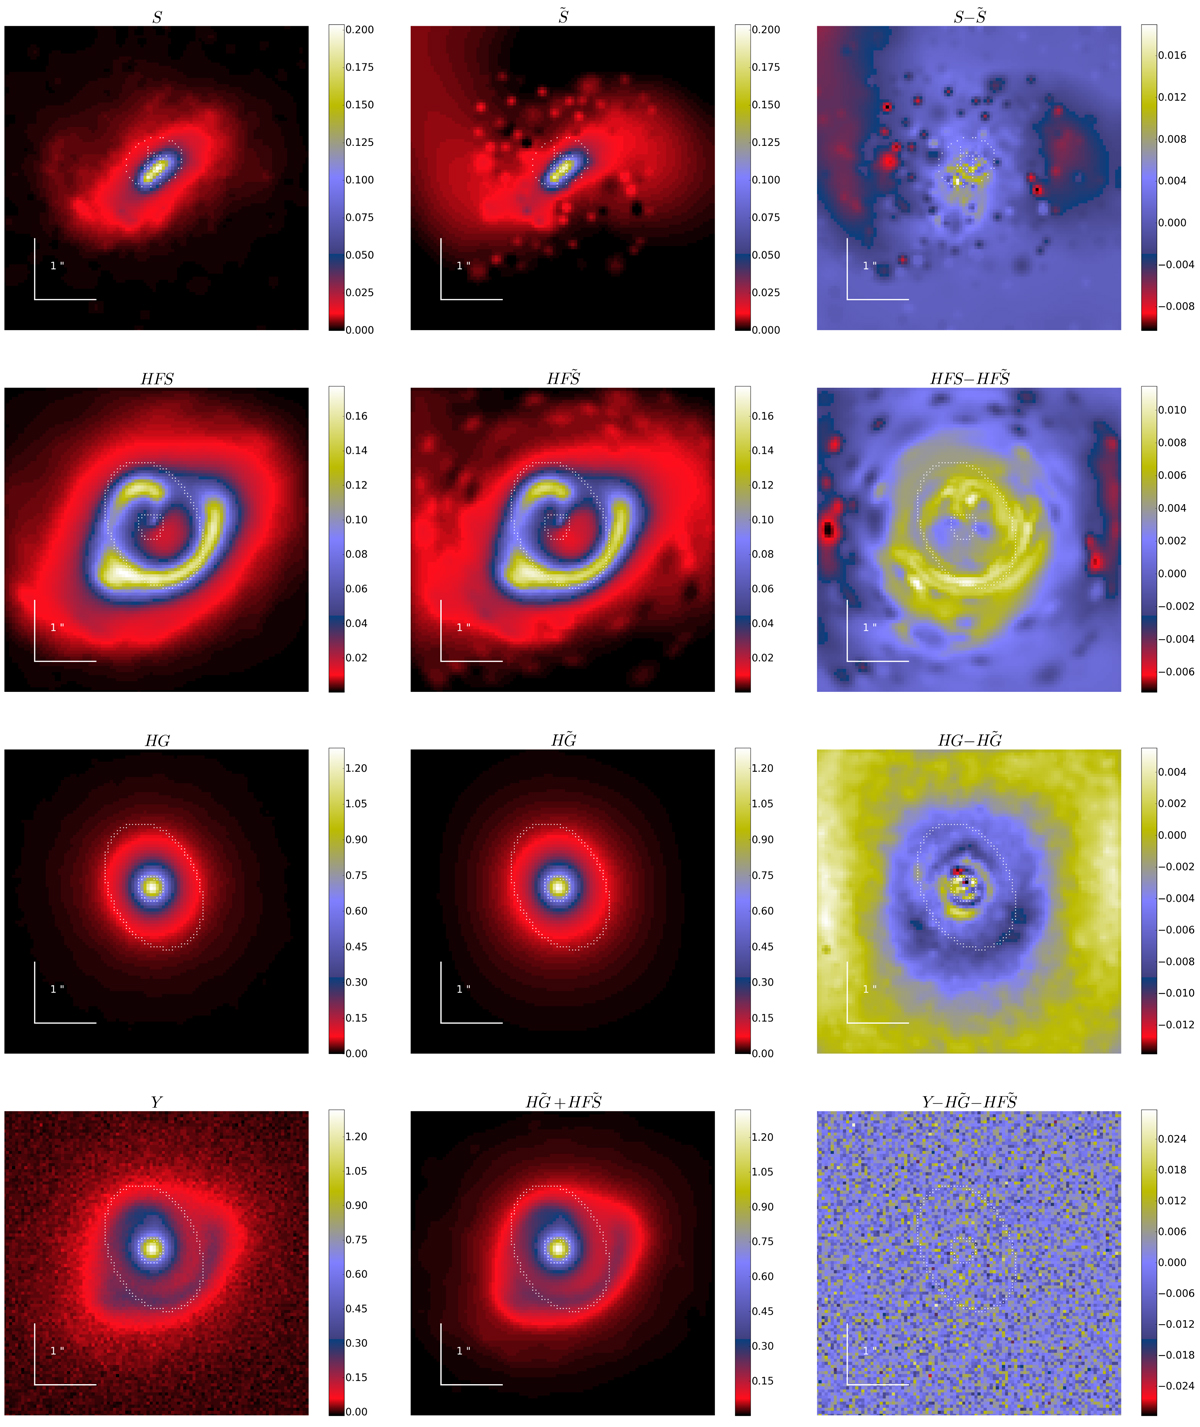
Illustration of the SLIT_MCA algorithm with simulated data. Left: simulated ground truths. From top to bottom are shown the original un-lensed source, its lensed version convolved with the PSF, the lensing galaxy (convolved with the PSF), and the full simulated system with noise. Middle: output of the SLIT_MCA algorithm. Right: differences between the left and middle panels. The original and reconstructed images are displayed with the same colour cuts. The residuals in the bottom right panel are shown with cuts set to ±5σ. White dots show the positions of pixels crossed by critical lines in the lens plane and by caustics in the source plane.
Current usage metrics show cumulative count of Article Views (full-text article views including HTML views, PDF and ePub downloads, according to the available data) and Abstracts Views on Vision4Press platform.
Data correspond to usage on the plateform after 2015. The current usage metrics is available 48-96 hours after online publication and is updated daily on week days.
Initial download of the metrics may take a while.