Fig. 2.
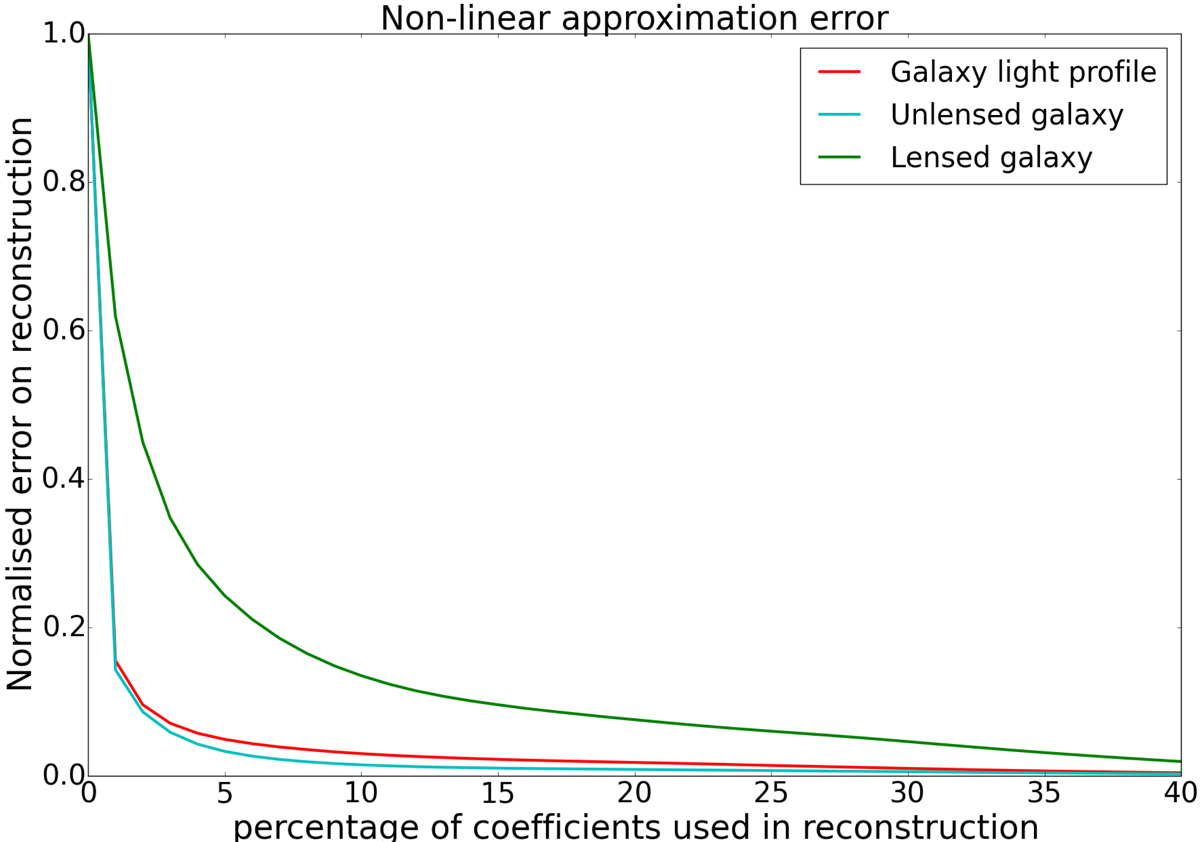
Normalised non-linear approximation (NLA; Sect. 5.2) of galaxies projected in the source and lens planes. The red curve illustrates the average NLA of galaxy images that can be seen as source or lens galaxies, the cyan curve shows the average NLA of the same galaxies once projected from lens to source plane, and the green curve shows the NLA of the same galaxies projected to lens plane.
Current usage metrics show cumulative count of Article Views (full-text article views including HTML views, PDF and ePub downloads, according to the available data) and Abstracts Views on Vision4Press platform.
Data correspond to usage on the plateform after 2015. The current usage metrics is available 48-96 hours after online publication and is updated daily on week days.
Initial download of the metrics may take a while.