Fig. A.1.
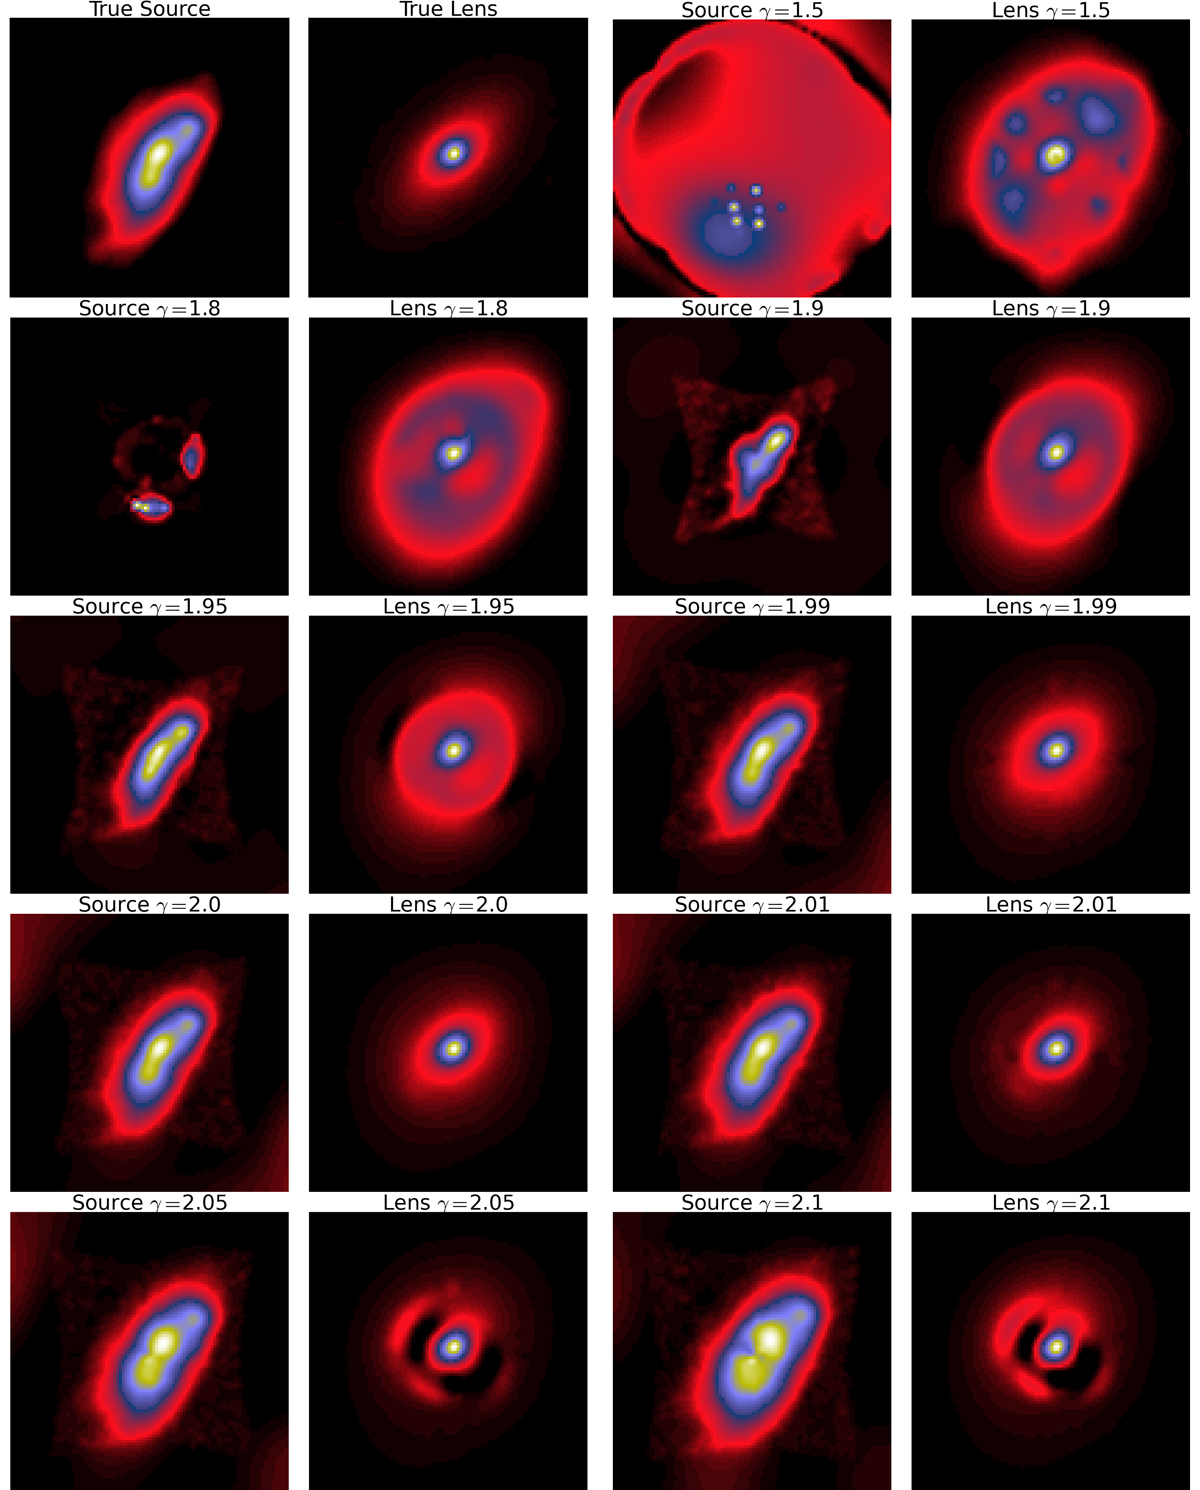
Reconstructions of lens and source light profiles for various values of mass density slope of a lens generated with a mass density slope of 2. The first two panels show the true source (left-hand side) and lens (right-hand side) light profiles used to generate the simulated images. The other pairs of panels from left to right and from top to bottom show the source and lens reconstructions for increasing values of ![]() .
.
Current usage metrics show cumulative count of Article Views (full-text article views including HTML views, PDF and ePub downloads, according to the available data) and Abstracts Views on Vision4Press platform.
Data correspond to usage on the plateform after 2015. The current usage metrics is available 48-96 hours after online publication and is updated daily on week days.
Initial download of the metrics may take a while.