Fig. 7.
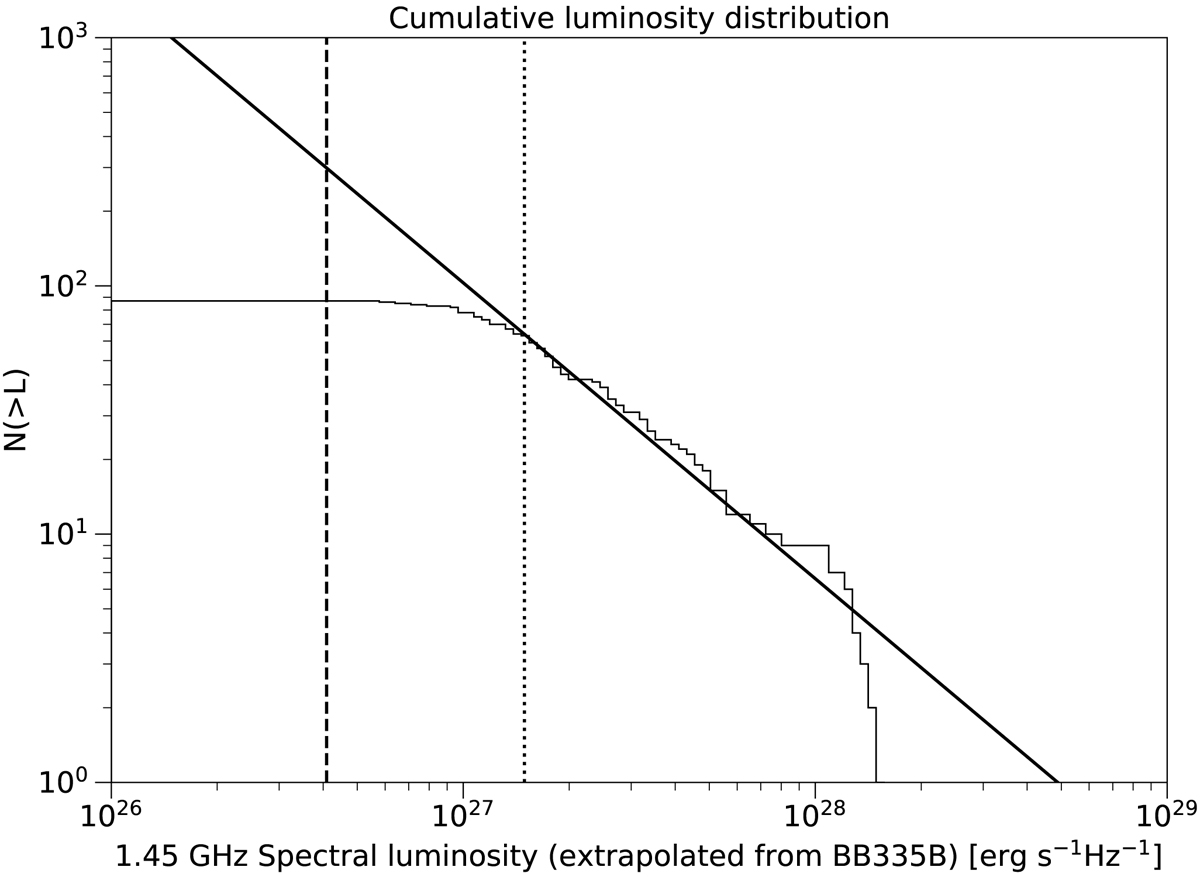
Cumulative luminosity function for the 88 sources detected in BB335B_C (of the total 97 sources detected in all epochs). To be directly comparable with Fig. 1 of Chomiuk & Wilcots 2009, the luminosities have been extrapolated from Tables 3 and 4 to 1.45 GHz, assuming a spectral index of −0.5. A power-law fit it shown as a solid line. The point source detection limit is shown as a vertical black dashed line to the left, and fitted completeness limit (where the power law turns over) is shown as a dotted line.
Current usage metrics show cumulative count of Article Views (full-text article views including HTML views, PDF and ePub downloads, according to the available data) and Abstracts Views on Vision4Press platform.
Data correspond to usage on the plateform after 2015. The current usage metrics is available 48-96 hours after online publication and is updated daily on week days.
Initial download of the metrics may take a while.