Fig. 4.
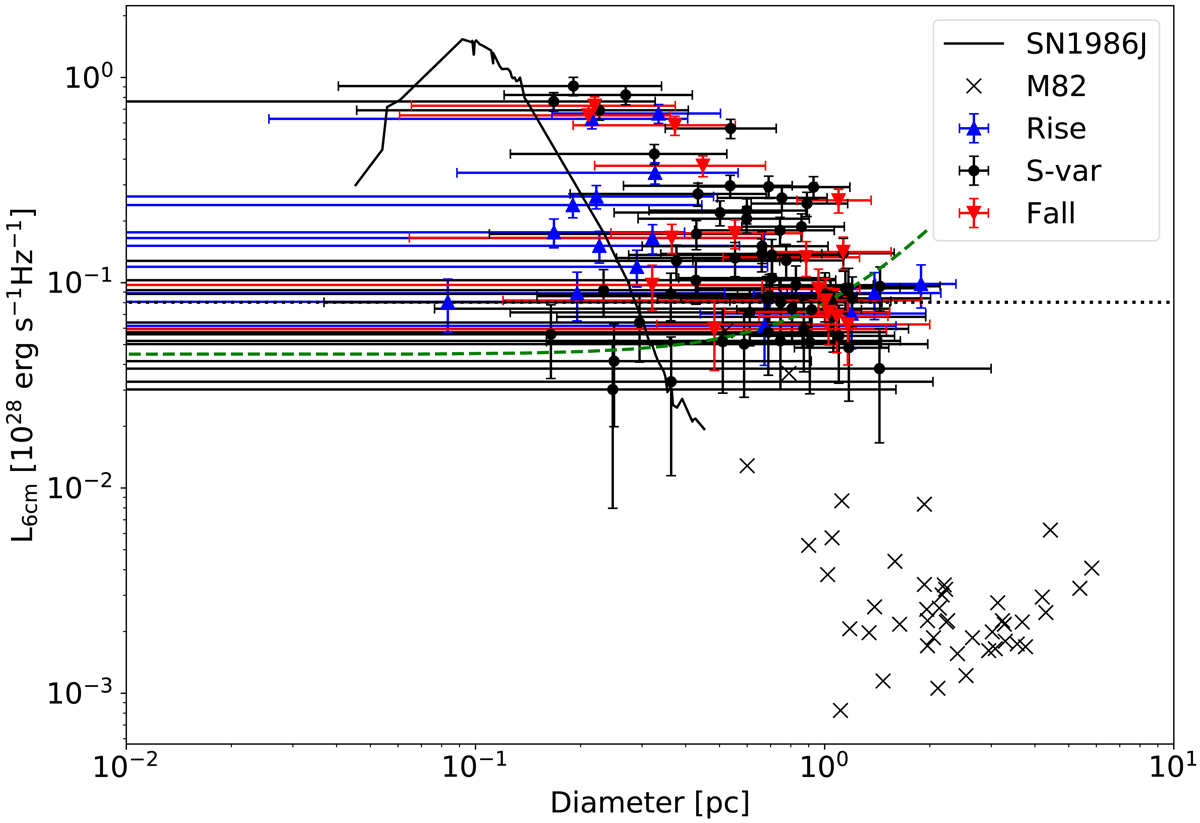
Data in Tables 3 and 4 plotted as spectral luminosity vs diameter in log–log scale. The surface brightness detection limit of BB335B is shown as a dashed line, and the fitted luminosity completeness limit Lc, as derived in Sect. 3.4, is shown as a dotted line. The lower panel show 45 SNRs in M 82 plotted as black crosses (data from Huang et al. 1994, their Table 2, scaled to 6 cm assuming α = −0.5). The evolution of SN1986J during its first 30 years is plotted as a solid curve, from the model described in Sect. 3.1.
Current usage metrics show cumulative count of Article Views (full-text article views including HTML views, PDF and ePub downloads, according to the available data) and Abstracts Views on Vision4Press platform.
Data correspond to usage on the plateform after 2015. The current usage metrics is available 48-96 hours after online publication and is updated daily on week days.
Initial download of the metrics may take a while.