Fig. 3.
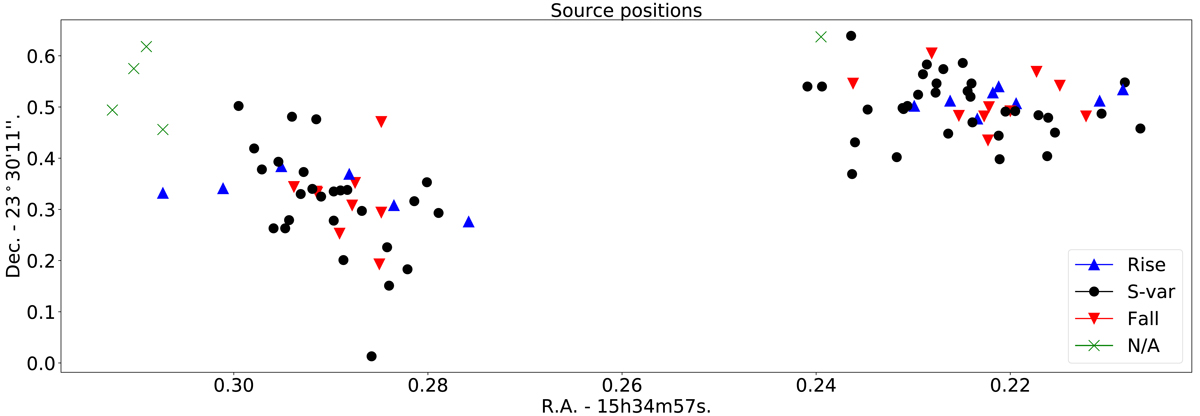
Spatial distribution of all sources given in Tables 3 and 4 with the eastern nucleus to the left and the western nucleus to the right. Each source is coloured by its observational classification (including not classified, or N/A), as described in Sect. 2.5. We note that a few sources are detected in the eastern nucleus outside the central cutout region shown in Fig. 1a.
Current usage metrics show cumulative count of Article Views (full-text article views including HTML views, PDF and ePub downloads, according to the available data) and Abstracts Views on Vision4Press platform.
Data correspond to usage on the plateform after 2015. The current usage metrics is available 48-96 hours after online publication and is updated daily on week days.
Initial download of the metrics may take a while.