Fig. 2.
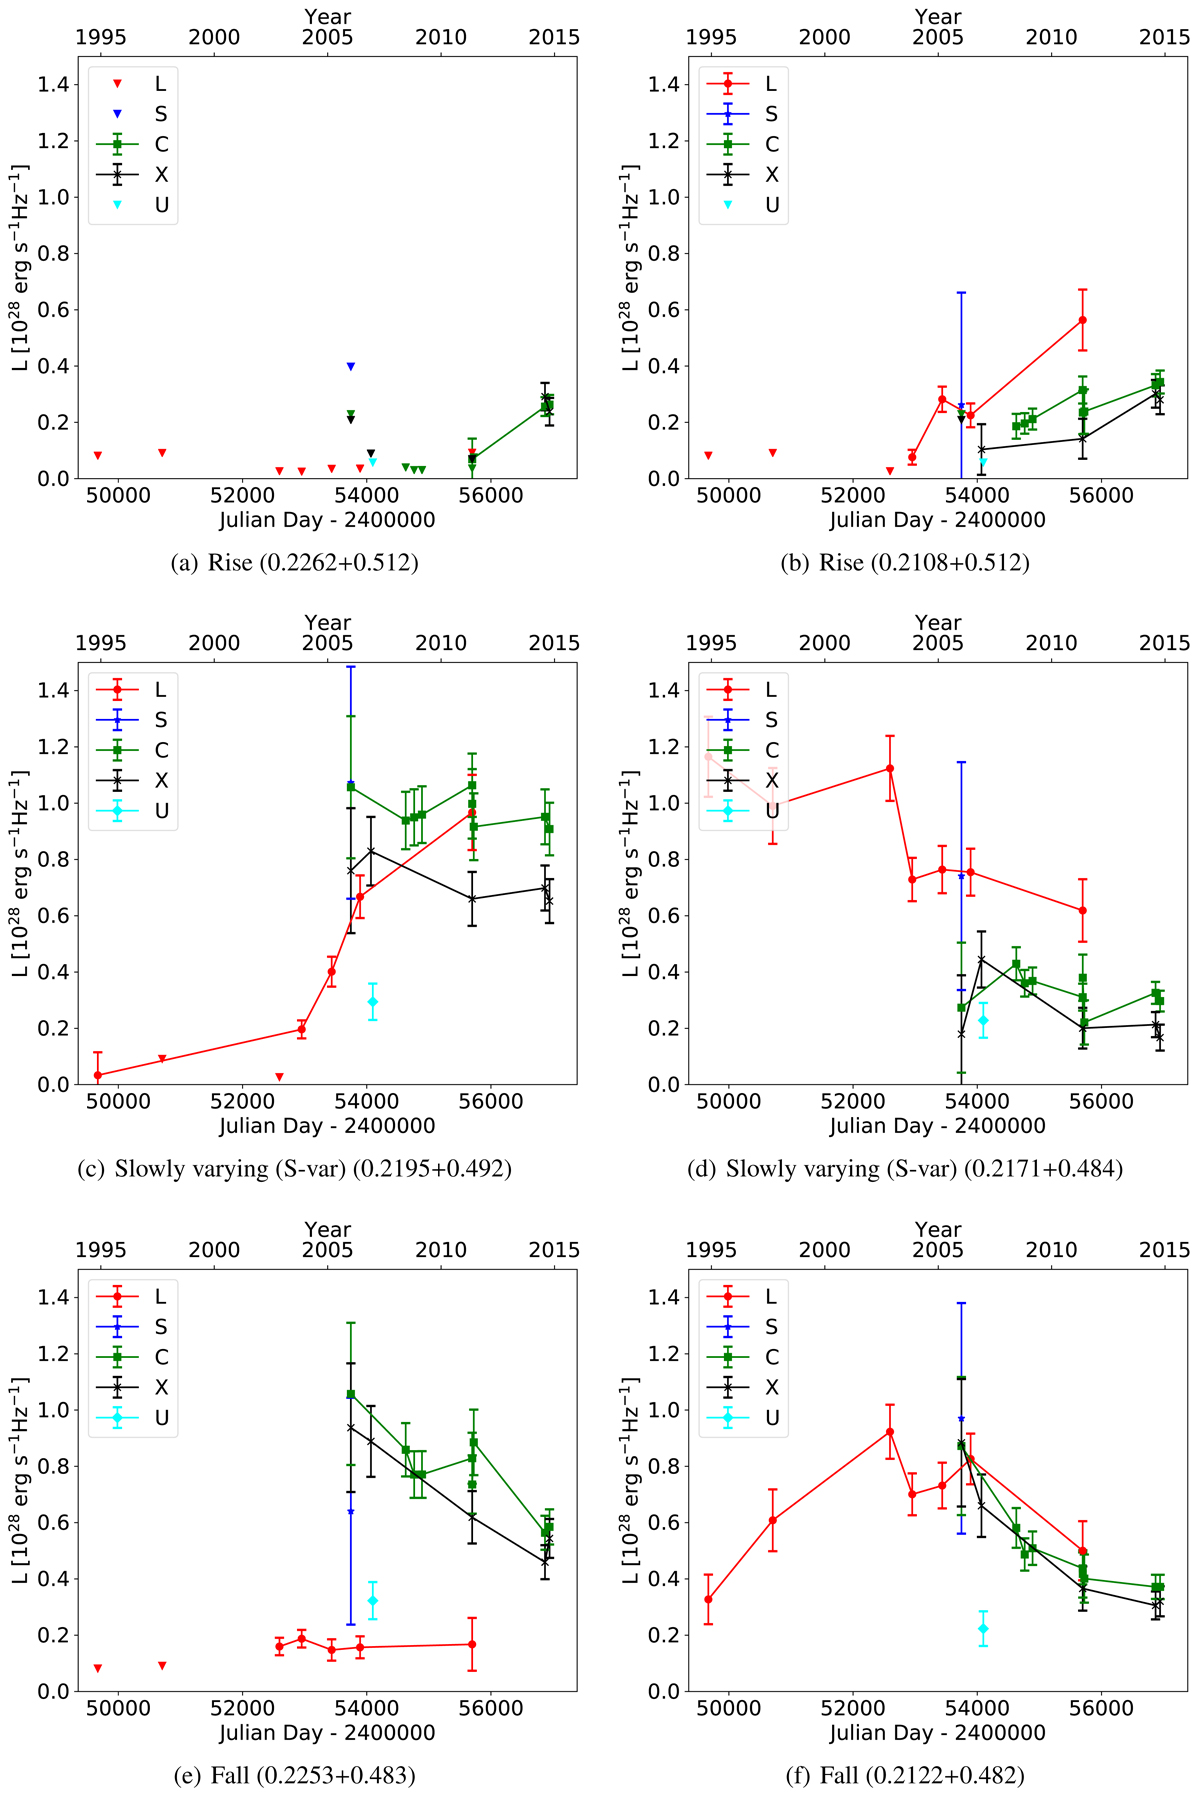
Lightcurves to illustrate the source classifications Rise, Slowly varying (or S-var) and Fall used in this paper. For the purpose of the discussion, two sources are shown for each class, to show the differences in multi-frequency behaviour within the classes. All panels have the same scale for easy comparison. The horizontal axis below the panels show time in Julian Days, while the horizontal axis on top of the panels show the time in decimal years. In Sect. 4.3 we argue that these lightcurves are consistent with SNe/SNRs in different evolutionary stages, where the approximate time order corresponds to panels a–d, f. Panel e: may represent a stage similar to f but with significant free–free absorption. Note that the label L on the vertical axis here denotes spectral luminosity.
Current usage metrics show cumulative count of Article Views (full-text article views including HTML views, PDF and ePub downloads, according to the available data) and Abstracts Views on Vision4Press platform.
Data correspond to usage on the plateform after 2015. The current usage metrics is available 48-96 hours after online publication and is updated daily on week days.
Initial download of the metrics may take a while.