Fig. E.1.
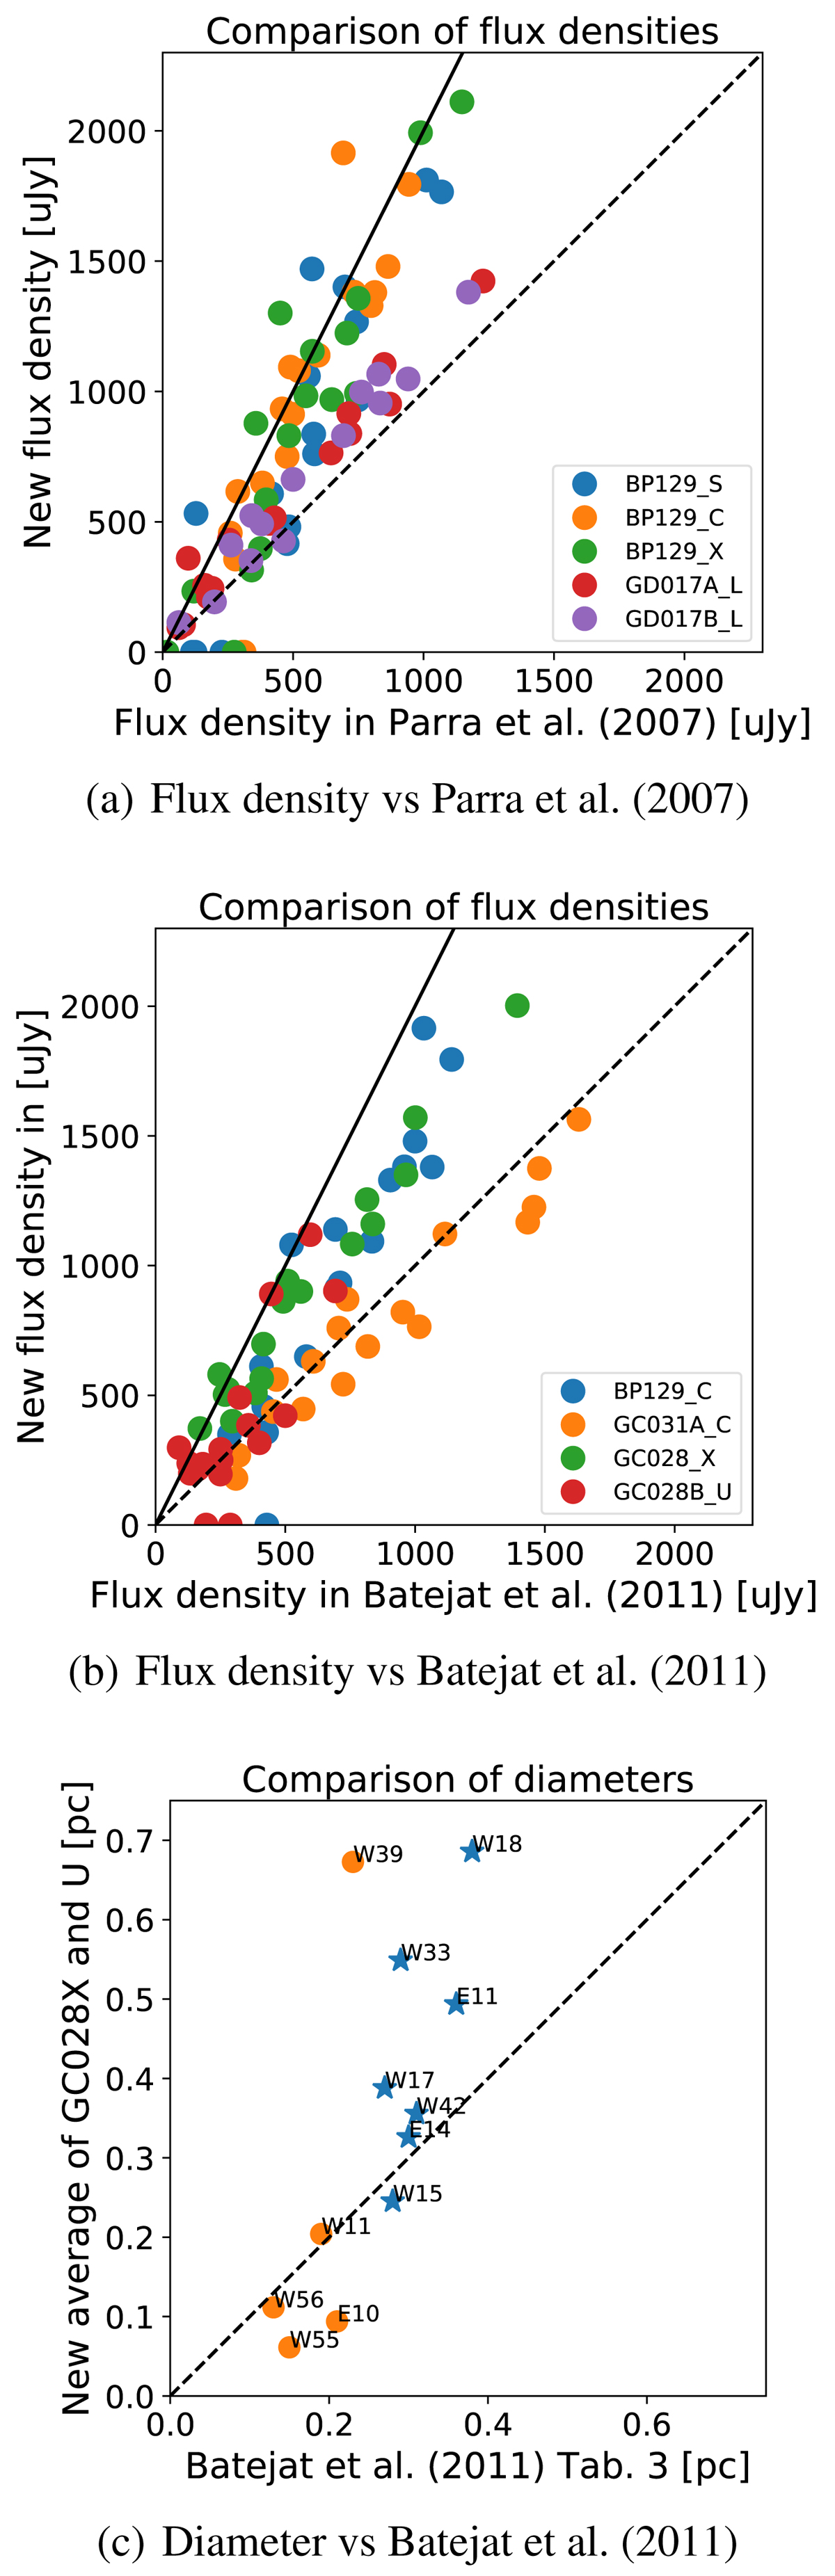
Comparison of flux densities and sizes measured in this work with previously published values using the same data. The dashed lines indicate a one-to-one correspondence, and the solid lines indicate the new values to be a factor of 2 higher than the ones previously published. In Fig. 1c, stars mark sources resolved at both bands by Batejat et al. (2011) (bold face in their Table 3) while circles mark the remaining sources. See Appendix E for a discussion of discrepancies.
Current usage metrics show cumulative count of Article Views (full-text article views including HTML views, PDF and ePub downloads, according to the available data) and Abstracts Views on Vision4Press platform.
Data correspond to usage on the plateform after 2015. The current usage metrics is available 48-96 hours after online publication and is updated daily on week days.
Initial download of the metrics may take a while.