Fig. D.1.
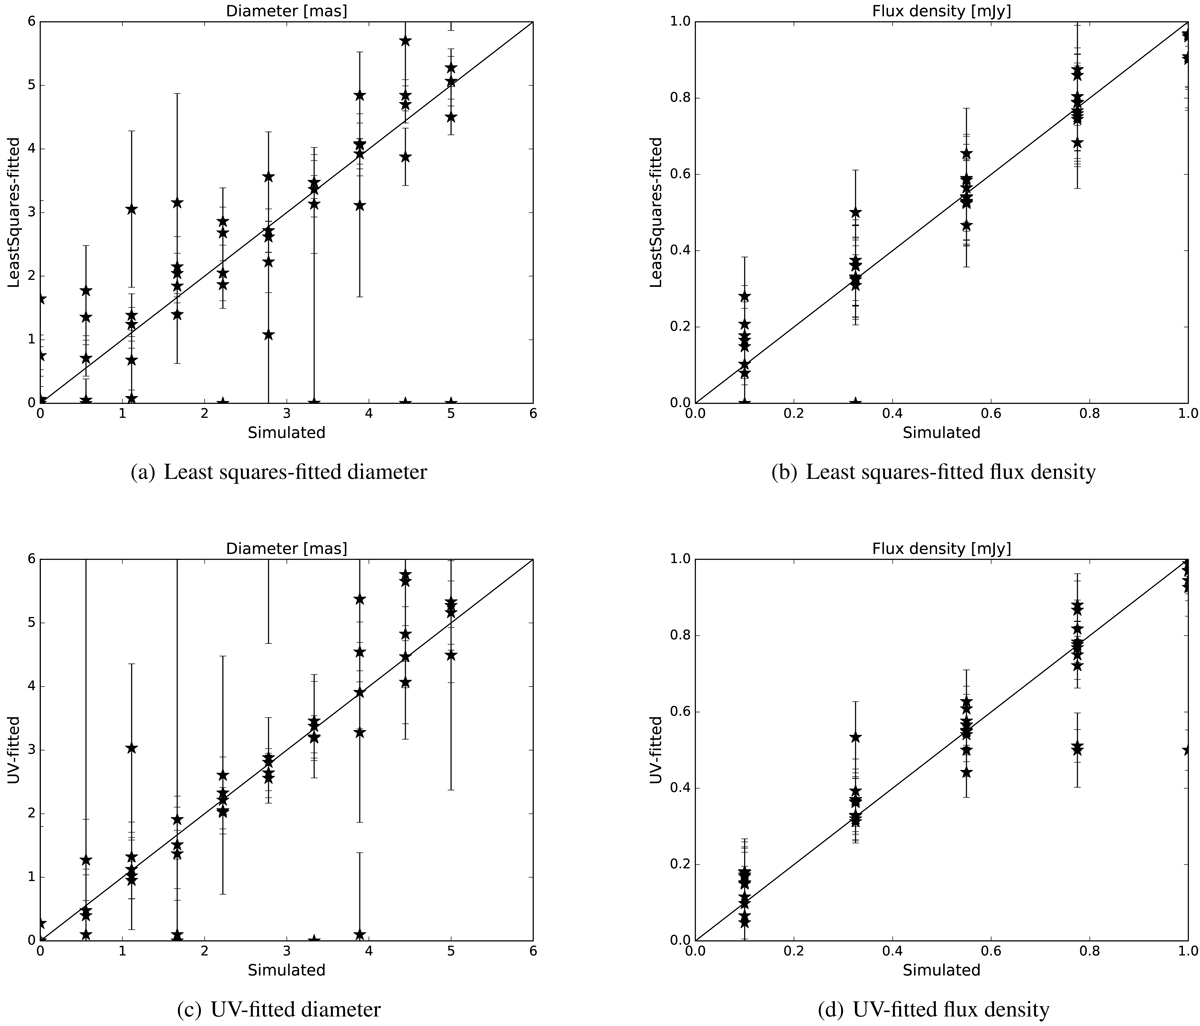
Recovered diameters and flux densities for simulated data using three different methods: LS-fitting (first row) and UV-fitting (second row). The values for these figures are presented in Table D.1. Cases where no fit was attempted in (at least one) method are included for completeness, but displaced as both value 0 and uncertainty 0 on the representative method axis.
Current usage metrics show cumulative count of Article Views (full-text article views including HTML views, PDF and ePub downloads, according to the available data) and Abstracts Views on Vision4Press platform.
Data correspond to usage on the plateform after 2015. The current usage metrics is available 48-96 hours after online publication and is updated daily on week days.
Initial download of the metrics may take a while.