Fig. C.2.
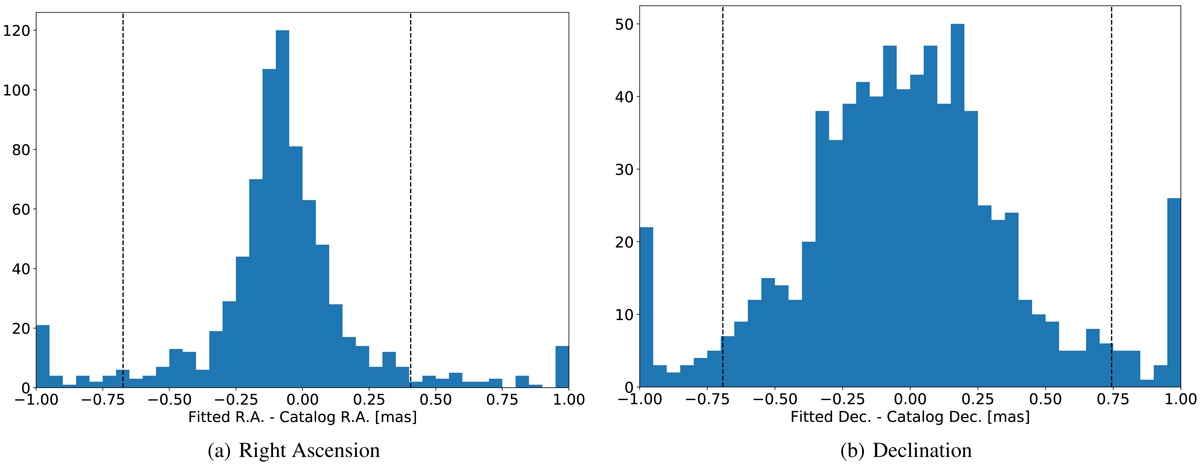
Comparison of fitted positions with catalogue positions given in Tables 3 and 4. The dashed lines mark the 5% and 95% percentiles. The majority of fitting results are well within our target accuracy of ±1 mas. The larger dispersion in Dec compared to RA is explained by the synthesised beam being elongated approximately north-south in most epochs. Note that 18 cm fits are not included in this figure; the spread in RA is very similar for 18 cm, but the fitting in Dec is much less well constrained because of the relatively large major axis of the synthesised beam.
Current usage metrics show cumulative count of Article Views (full-text article views including HTML views, PDF and ePub downloads, according to the available data) and Abstracts Views on Vision4Press platform.
Data correspond to usage on the plateform after 2015. The current usage metrics is available 48-96 hours after online publication and is updated daily on week days.
Initial download of the metrics may take a while.