Fig. 7.
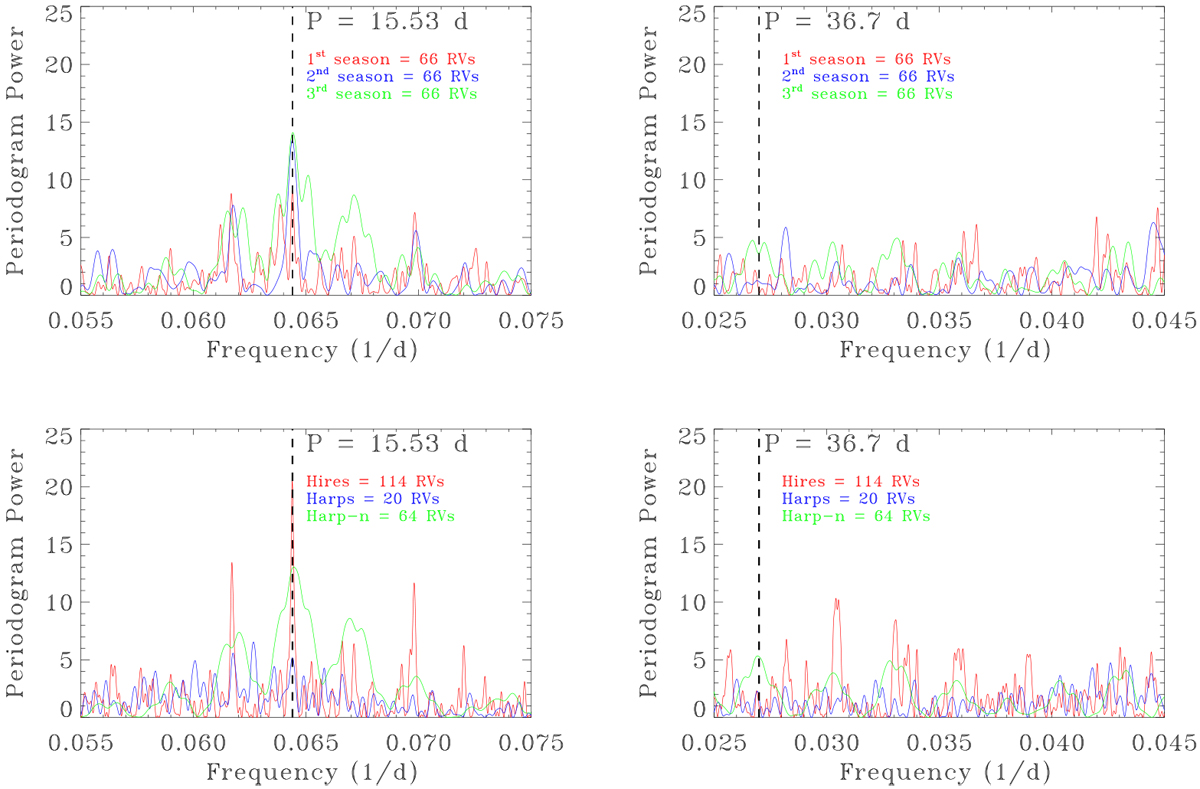
GLS periodograms around the frequency ranges of interest. Two upper panels: three equal subsets of the composite RV data. Each season has 66 data points: the three seasons, in order, are shown in red, blue, and green, respectively. Two lower panels: separate telescope RV datasets. The HIRES periodogram is plotted in red, the HARPS in blue, and the HARPS-N in green. Left panels: frequency related to the candidate planet (f = 0.064 d−1 – P = 15.53 d). Right panels: frequency related to activity (f = 0.027 d−1 – P = 36.7 d), as suggestedfrom RV analysis, Gaussian Processes as well as by several activity indicators and ASAS photometry.
Current usage metrics show cumulative count of Article Views (full-text article views including HTML views, PDF and ePub downloads, according to the available data) and Abstracts Views on Vision4Press platform.
Data correspond to usage on the plateform after 2015. The current usage metrics is available 48-96 hours after online publication and is updated daily on week days.
Initial download of the metrics may take a while.