Fig. 6.
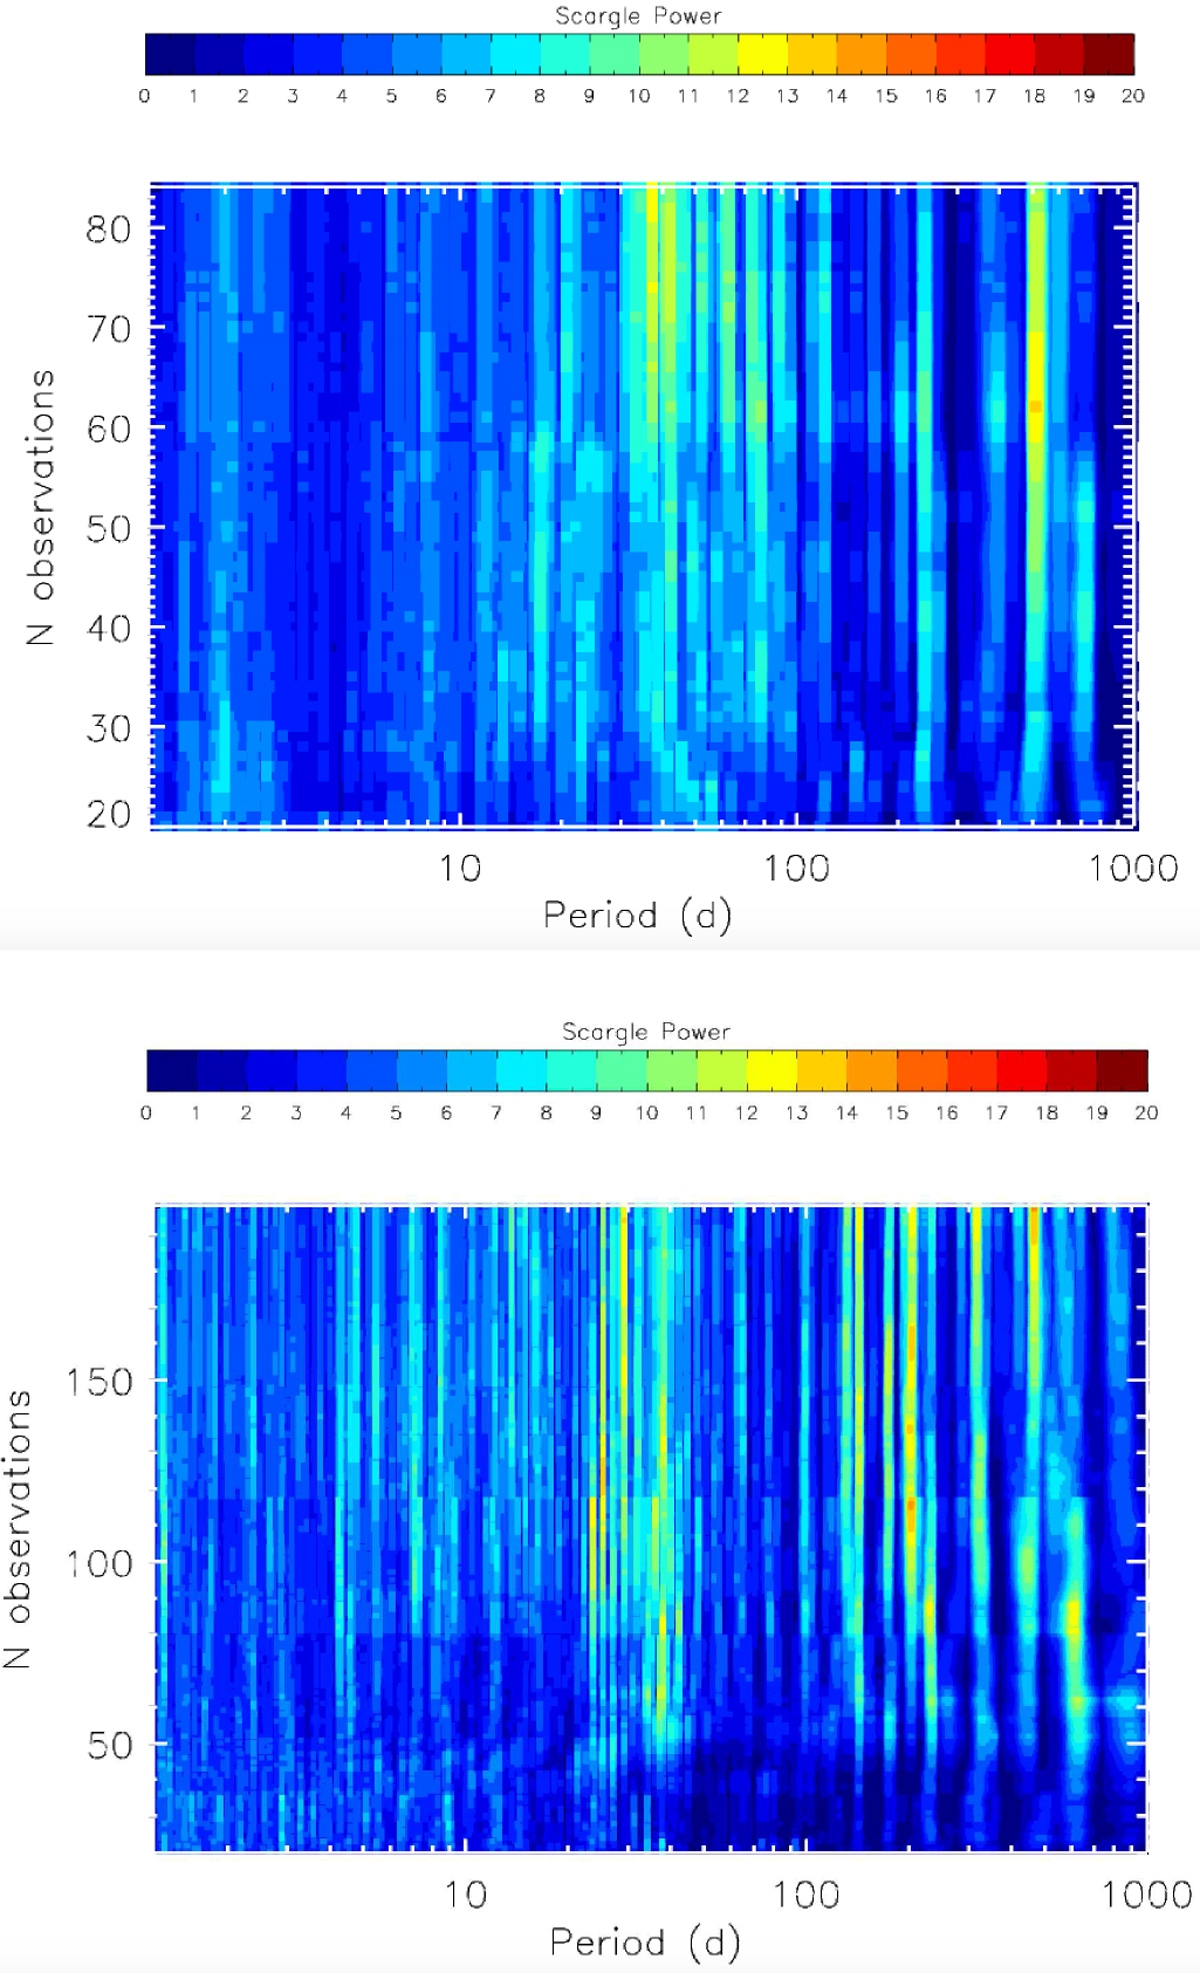
Periodogram power of the inspected periods as a function of the number of observations for the Hα (top panel) and S-index (bottom panel) time series. There are several significant periods larger than 100 d, probably due to long trends and a series of significant periods of between 27 and 42 d for S index and around 40 d for Hα.
Current usage metrics show cumulative count of Article Views (full-text article views including HTML views, PDF and ePub downloads, according to the available data) and Abstracts Views on Vision4Press platform.
Data correspond to usage on the plateform after 2015. The current usage metrics is available 48-96 hours after online publication and is updated daily on week days.
Initial download of the metrics may take a while.