Free Access
Fig. 3.
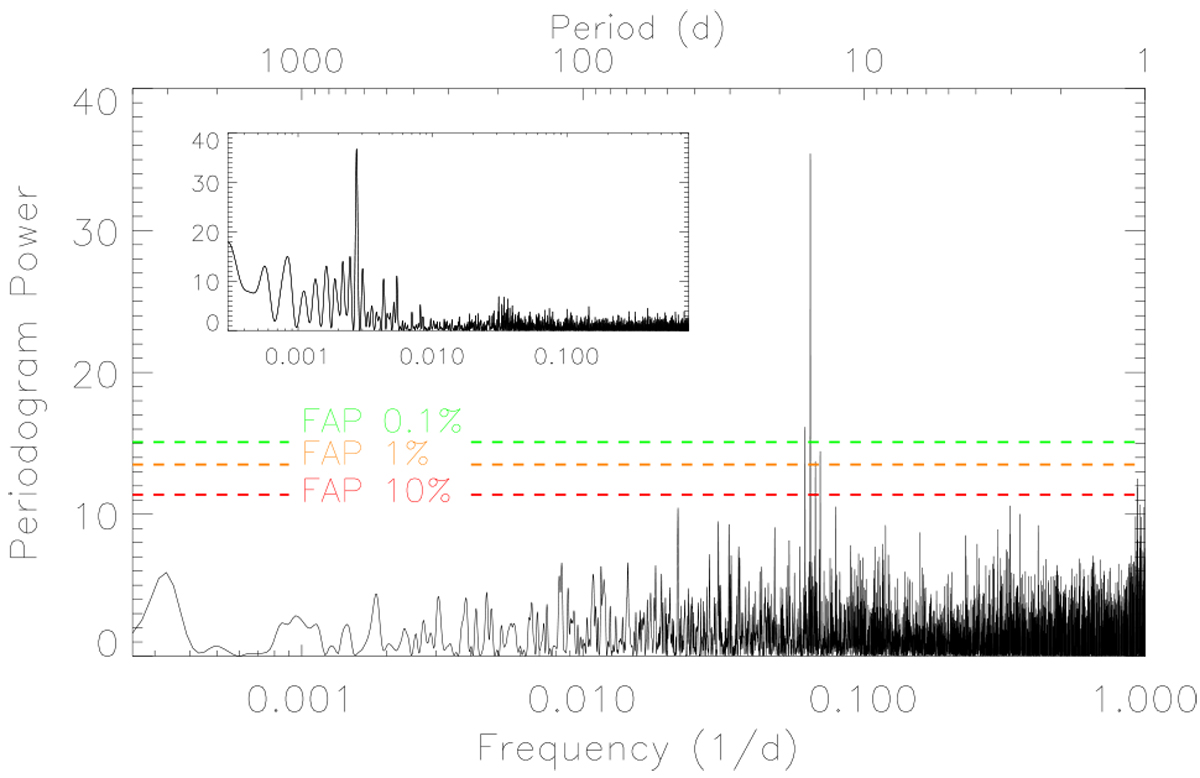
GLS periodogram of the complete dataset (HIRES+HARPS+ HARPS-N). The dashed lines indicate 0.1, 1, and 10% levels of FAP. The spectral window is shown in the inset panel and the highest peak is related to the one-year alias.
Current usage metrics show cumulative count of Article Views (full-text article views including HTML views, PDF and ePub downloads, according to the available data) and Abstracts Views on Vision4Press platform.
Data correspond to usage on the plateform after 2015. The current usage metrics is available 48-96 hours after online publication and is updated daily on week days.
Initial download of the metrics may take a while.