Free Access
Fig. A.3.
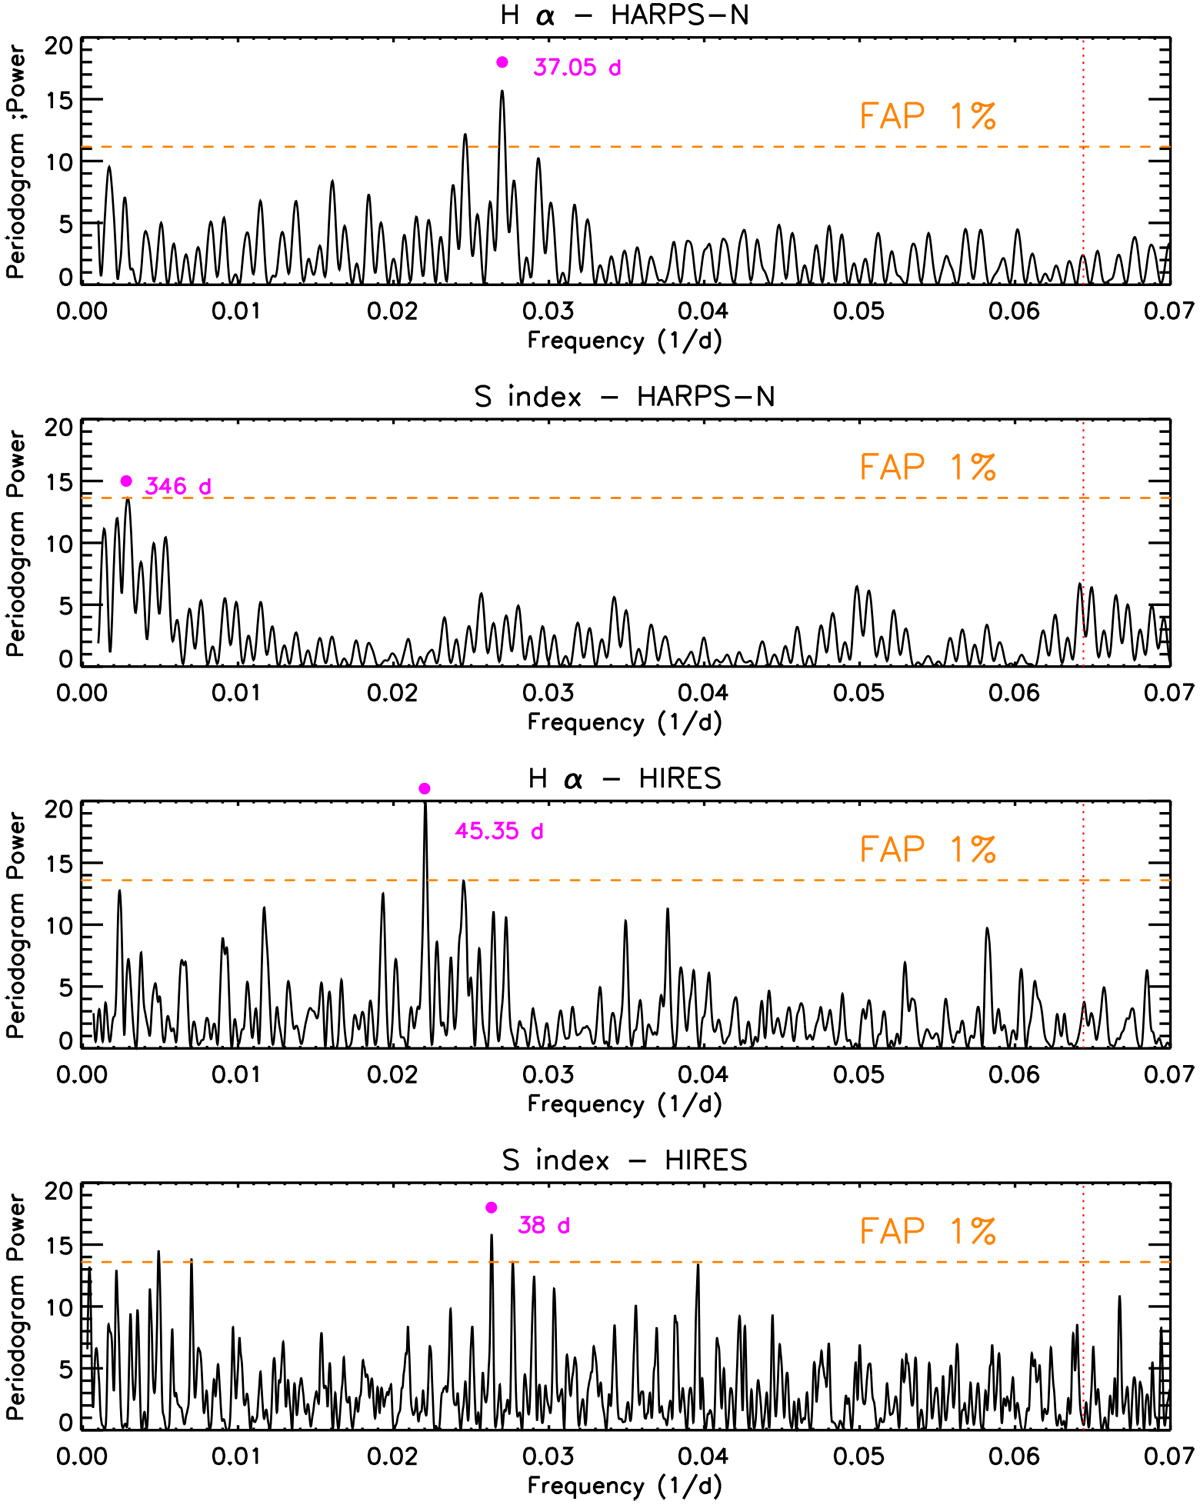
GLS periodograms of activity indexes (from top to bottom panels): Hα and Sindex (HARPS-N); Hα and Sindex (HIRES). The 15.5 d period is indicated in each periodogram, as the red dashed line. The significant periods discussed in Sect. 3.4, are indicated with a magenta dot.
Current usage metrics show cumulative count of Article Views (full-text article views including HTML views, PDF and ePub downloads, according to the available data) and Abstracts Views on Vision4Press platform.
Data correspond to usage on the plateform after 2015. The current usage metrics is available 48-96 hours after online publication and is updated daily on week days.
Initial download of the metrics may take a while.