Free Access
Fig. 10.
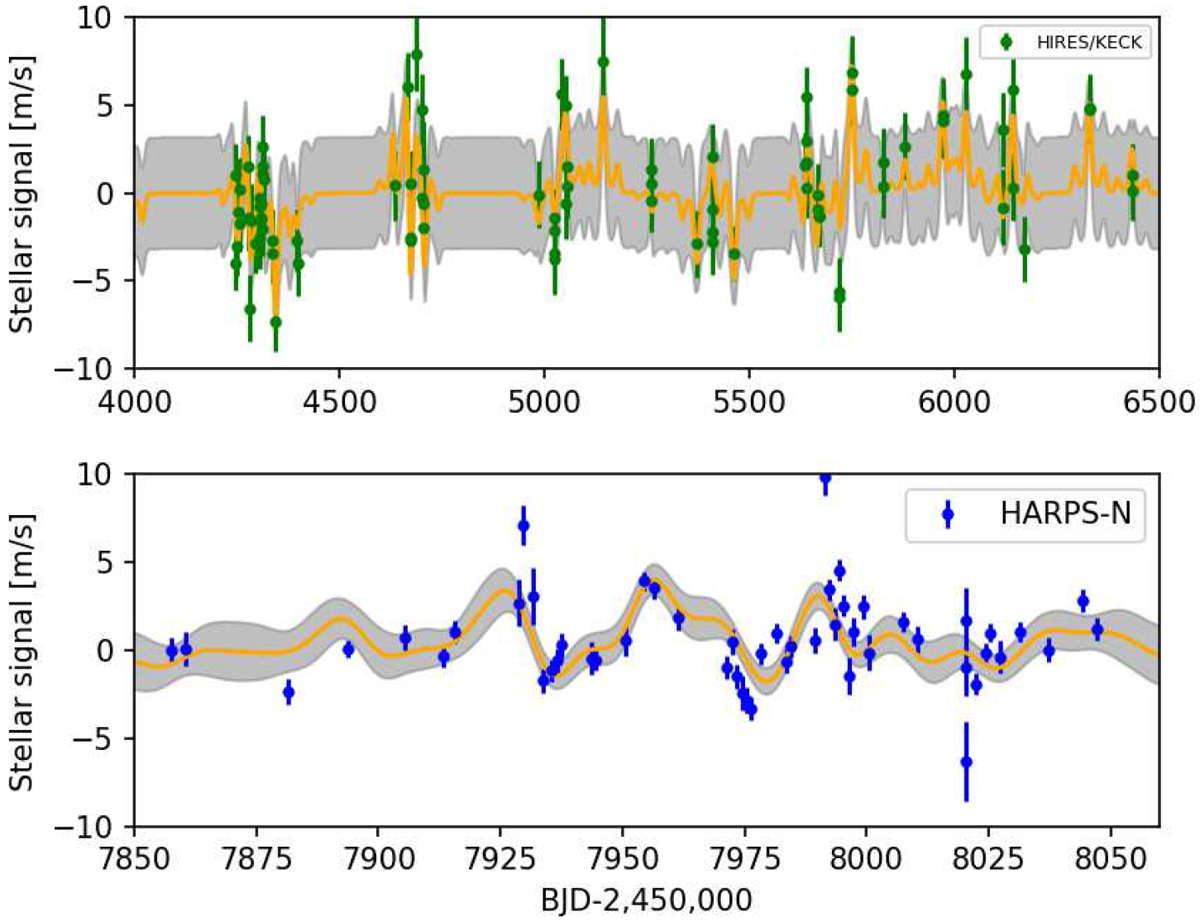
Blow-up of the best-fit quasi-periodic signal of two particularly crowded regions (orange line) for HIRES data (upper panel) and HARPS-N (lower panel), the grey areas mark the uncertainties band ± 1 σ.
Current usage metrics show cumulative count of Article Views (full-text article views including HTML views, PDF and ePub downloads, according to the available data) and Abstracts Views on Vision4Press platform.
Data correspond to usage on the plateform after 2015. The current usage metrics is available 48-96 hours after online publication and is updated daily on week days.
Initial download of the metrics may take a while.