Fig. 1.
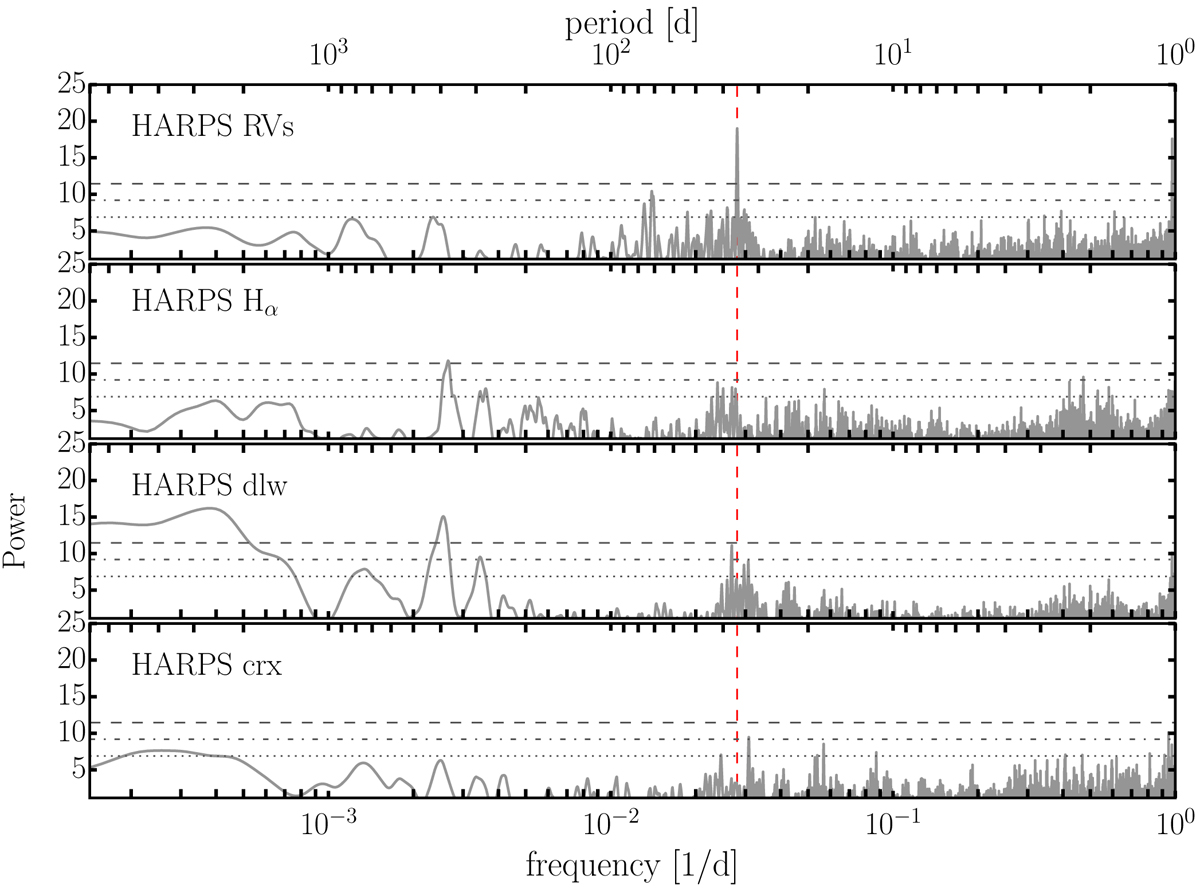
Top panel: GLS periodogram of the SERVAL time series of GJ 143 with levels of the false alarm probability (FAP) of 10% (dotted line), 1% (dot-dashed line) and 0.1% (dashed line). Second to fourth panel: activity indicators following Zechmeister et al. (2018), Hα line index, differential line width (dLW), and chromatic index (CRX). The HARPS RVs clearly exhibit a significant peak at 35.6 d, which has no counterpart in the activity indices.
Current usage metrics show cumulative count of Article Views (full-text article views including HTML views, PDF and ePub downloads, according to the available data) and Abstracts Views on Vision4Press platform.
Data correspond to usage on the plateform after 2015. The current usage metrics is available 48-96 hours after online publication and is updated daily on week days.
Initial download of the metrics may take a while.