Fig. 2.
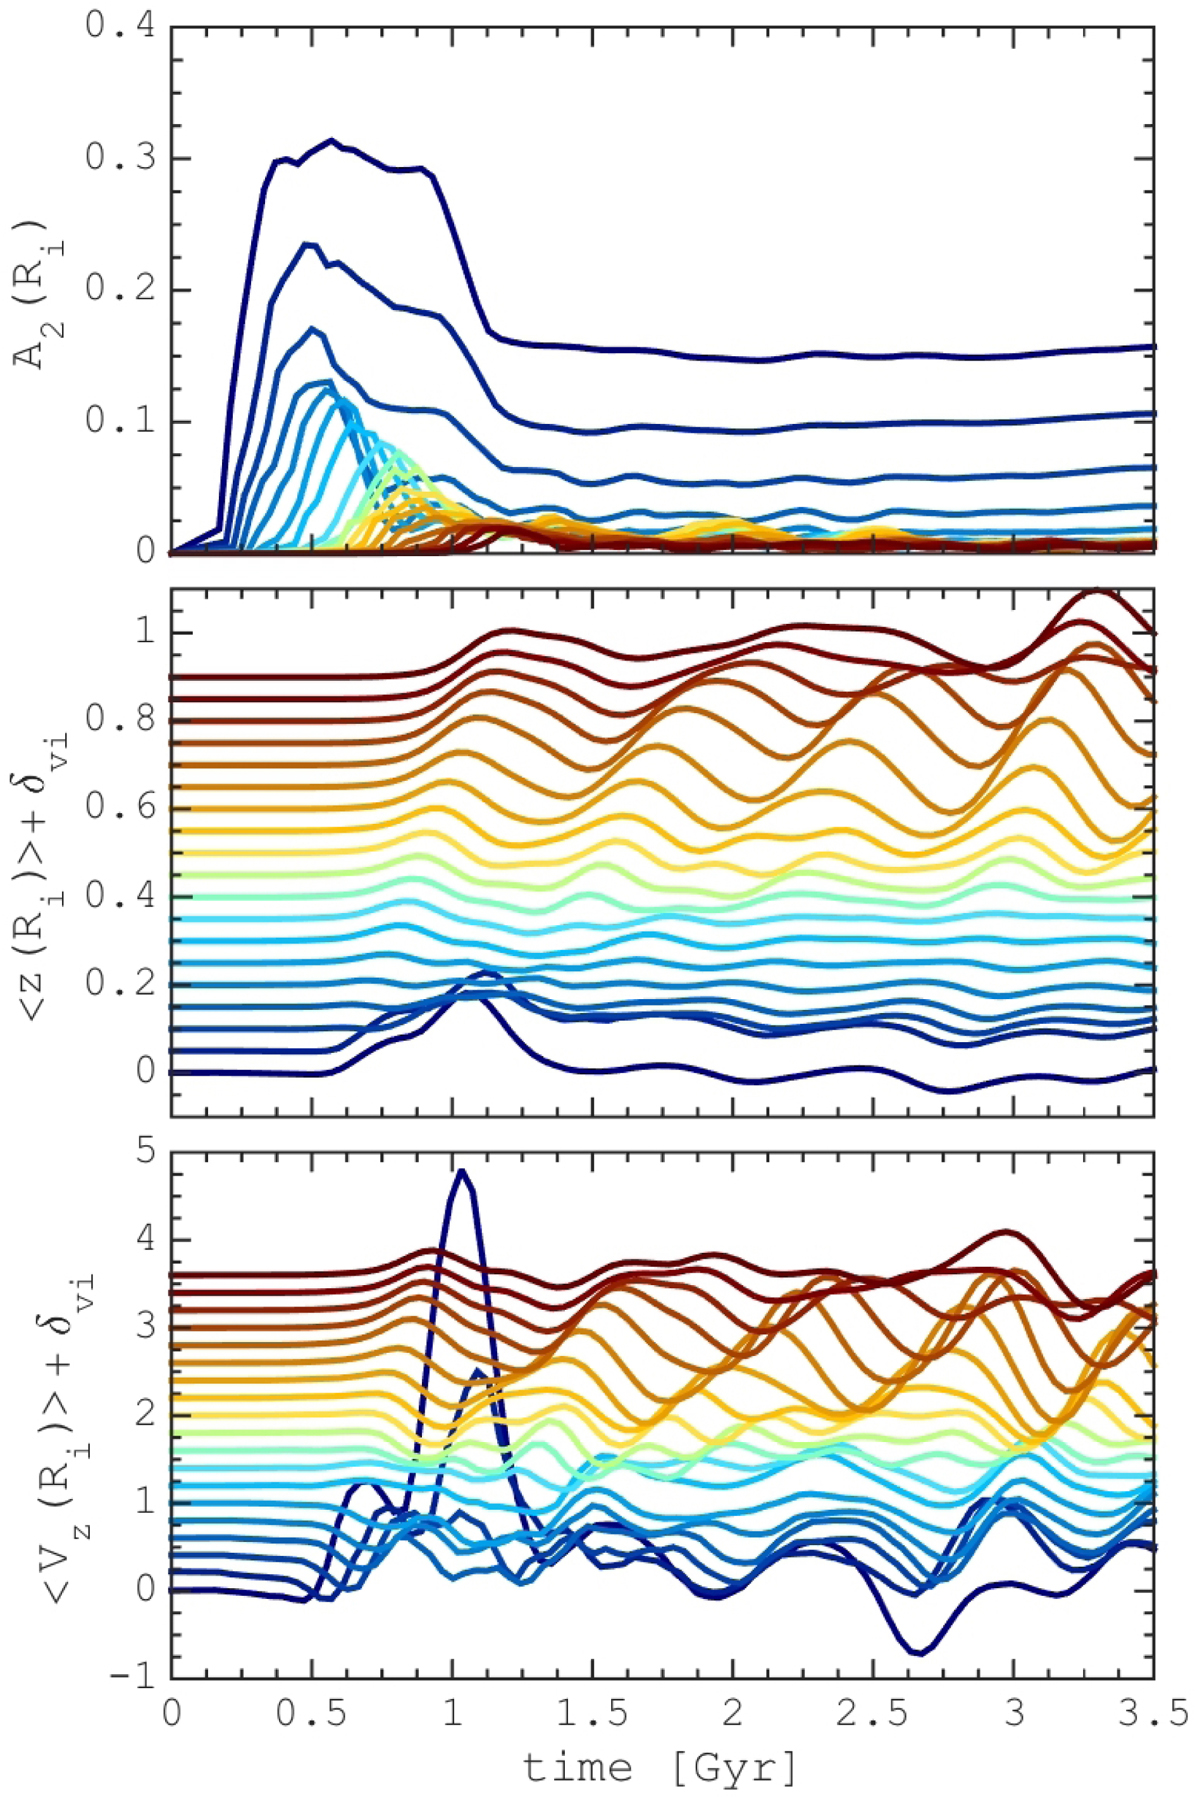
Evolution of the bar strength A2 (top panel), median vertical coordinate of particles (middle panel), and mean vertical velocity (bottom panel). All frames show the evolution of parameters at different radii in a circular annulus of 0.5 kpc width: from blue in the center to brown lines at the outskirts. To improve the visibility of the ⟨z⟩,⟨νz⟩ time-dependent variations we shift each curve relative to the previous by a constant value of δvi = 0.2 and δri = 0.05 for vertical velocity and vertical coordinate respectively. The end of the bar buckling phase corresponds to ≈1 Gyr.
Current usage metrics show cumulative count of Article Views (full-text article views including HTML views, PDF and ePub downloads, according to the available data) and Abstracts Views on Vision4Press platform.
Data correspond to usage on the plateform after 2015. The current usage metrics is available 48-96 hours after online publication and is updated daily on week days.
Initial download of the metrics may take a while.