Fig. 5.
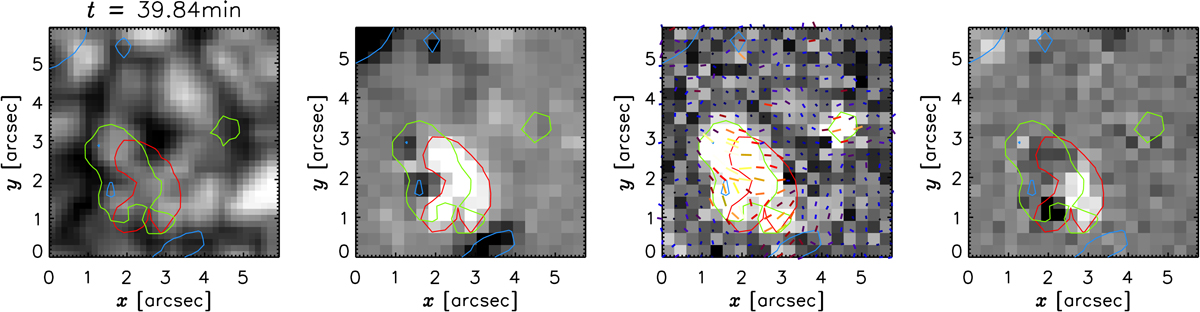
Snapshot of the online movie. From left to right, first image: continuum images with the time for the entire row indicated at the top of the first image. Second image: ![]() at a cutoff level of ±50 Mx cm−2 followed by images in
at a cutoff level of ±50 Mx cm−2 followed by images in ![]() at a cutoff level of 140 Mx cm2. Last image: obtained by subtracting the red lobe area in Stokes V from the blue lobe area. All images show contours of
at a cutoff level of 140 Mx cm2. Last image: obtained by subtracting the red lobe area in Stokes V from the blue lobe area. All images show contours of ![]() at a level of ±30 Mx cm−2 in blue and red, respectively. The green contours correspond to the apparent transverse magnetic flux density with a cutoff at
at a level of ±30 Mx cm−2 in blue and red, respectively. The green contours correspond to the apparent transverse magnetic flux density with a cutoff at ![]() Mx cm−2. The lines overlaid on top of the third image starting from t = 36.22 min correspond to the horizontal magnetic field direction obtained from the SIR inversions.
Mx cm−2. The lines overlaid on top of the third image starting from t = 36.22 min correspond to the horizontal magnetic field direction obtained from the SIR inversions.
Current usage metrics show cumulative count of Article Views (full-text article views including HTML views, PDF and ePub downloads, according to the available data) and Abstracts Views on Vision4Press platform.
Data correspond to usage on the plateform after 2015. The current usage metrics is available 48-96 hours after online publication and is updated daily on week days.
Initial download of the metrics may take a while.