Fig. 4.
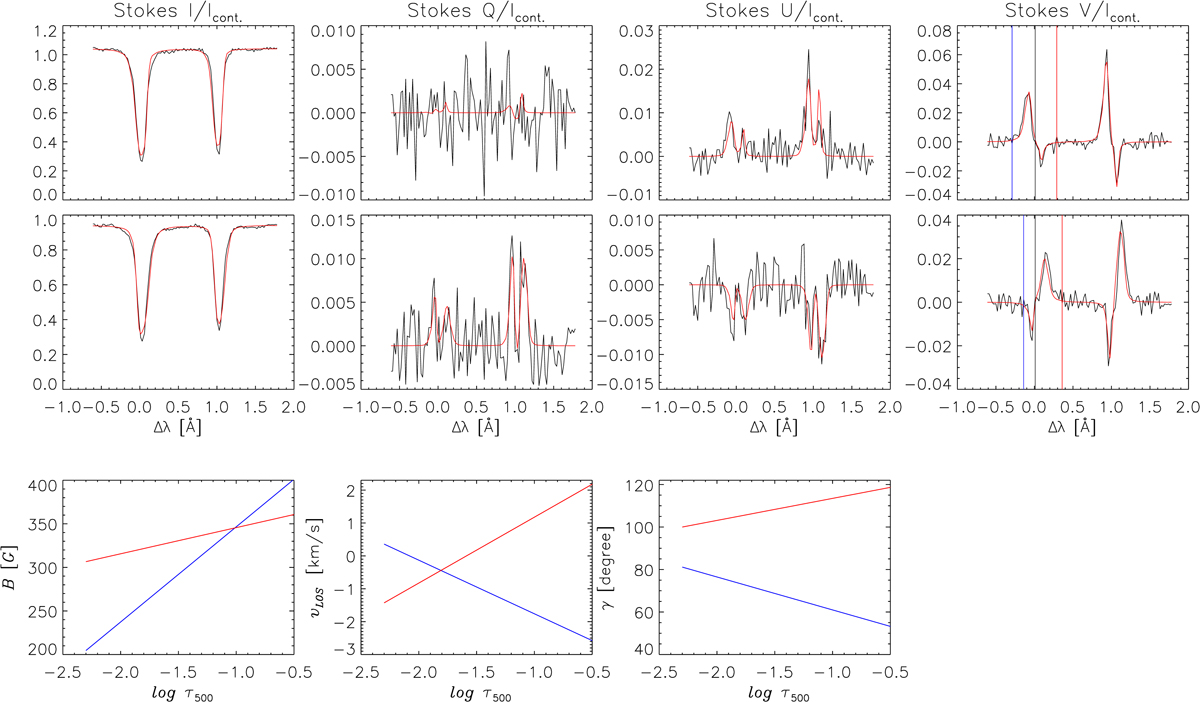
Stokes profiles and results from the SIR inversions. Upper row: results from the SIR inversions for a pixel located in an upflow region. The normalised observed Stokes profiles (black) as well as the fit (red) obtained from the inversions are shown. The wavelength scale corresponds to the Δλ from the laboratory wavelength of the Fe I 6301.498 Å line corrected for the gravitational redshift and convective blueshift (see Sect. 2). The vertical black line plotted in the Stokes V profile panel indicates the zero-crossing position, and the blue and red vertical lines indicate the encompassed region from which the area in the respective lobes is calculated. The second row is in the same format as the upper row, but now for a pixel located in a downflow region. Lower row: inversion results for the magnetic field strength (B), line-of-sight velocity (vLOS), and inclination angle γ for the blue-lobe dominant Stokes V profile with blue solid lines and for the red-lobe dominant Stokes V profile with red lines.
Current usage metrics show cumulative count of Article Views (full-text article views including HTML views, PDF and ePub downloads, according to the available data) and Abstracts Views on Vision4Press platform.
Data correspond to usage on the plateform after 2015. The current usage metrics is available 48-96 hours after online publication and is updated daily on week days.
Initial download of the metrics may take a while.