Fig. 1.
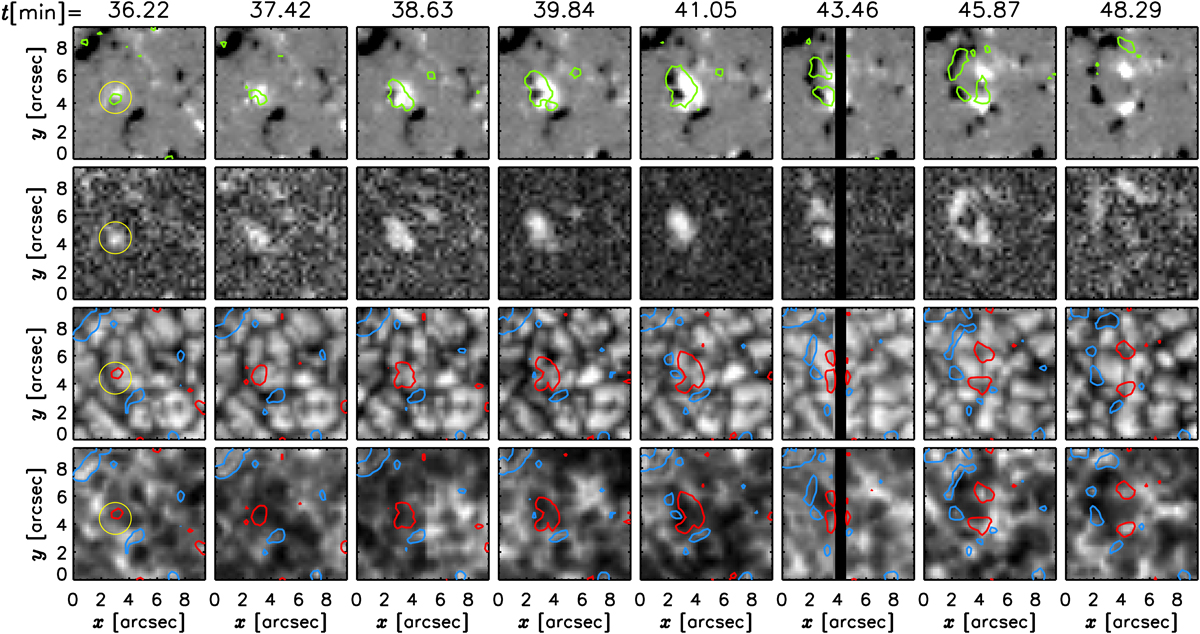
Temporal evolution of the emergence event. From left to right, top row: apparent longitudinal magnetic flux density with a cutoff at ![]() Mx cm−2. The contours in green outline the apparent transverse magnetic flux density at a level of
Mx cm−2. The contours in green outline the apparent transverse magnetic flux density at a level of ![]() of 140 Mx cm−2. Second row:
of 140 Mx cm−2. Second row: ![]() cut off at 320 Mx cm−2. Third row: continuum image with contours of
cut off at 320 Mx cm−2. Third row: continuum image with contours of ![]() at a level of ±30 Mx cm−2 in blue and red, respectively; last row: line core of the 630.15 nm line with the same contours as in the third row. The yellow circle encompasses the initial flux-emergence region.
at a level of ±30 Mx cm−2 in blue and red, respectively; last row: line core of the 630.15 nm line with the same contours as in the third row. The yellow circle encompasses the initial flux-emergence region.
Current usage metrics show cumulative count of Article Views (full-text article views including HTML views, PDF and ePub downloads, according to the available data) and Abstracts Views on Vision4Press platform.
Data correspond to usage on the plateform after 2015. The current usage metrics is available 48-96 hours after online publication and is updated daily on week days.
Initial download of the metrics may take a while.