Fig. 9.
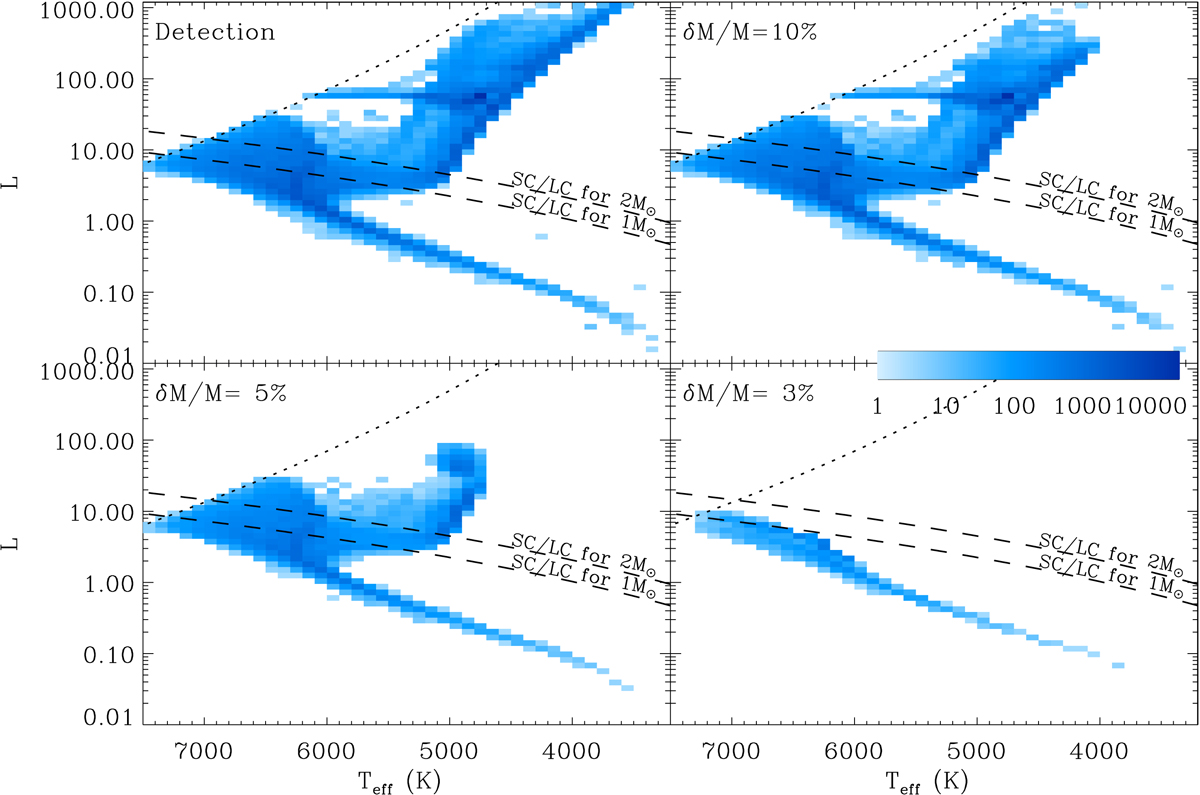
HR diagram of the stars of Fig. 8 observable in different conditions. The domain where stellar ages can be estimated at the 10%-level after grid-based modeling corresponds to the condition δM/M = 5% obtained from scaling relations. The color denotes the number of stars in bins with ΔTeff = 100 K and ΔL/L = 20%. The dotted line shows the red edge of the instability strip; the dashed lines show the limit between the short- and long-cadence acquisition mode of PLATO, for 1 or 2 M⊙.
Current usage metrics show cumulative count of Article Views (full-text article views including HTML views, PDF and ePub downloads, according to the available data) and Abstracts Views on Vision4Press platform.
Data correspond to usage on the plateform after 2015. The current usage metrics is available 48-96 hours after online publication and is updated daily on week days.
Initial download of the metrics may take a while.