Fig. 6.
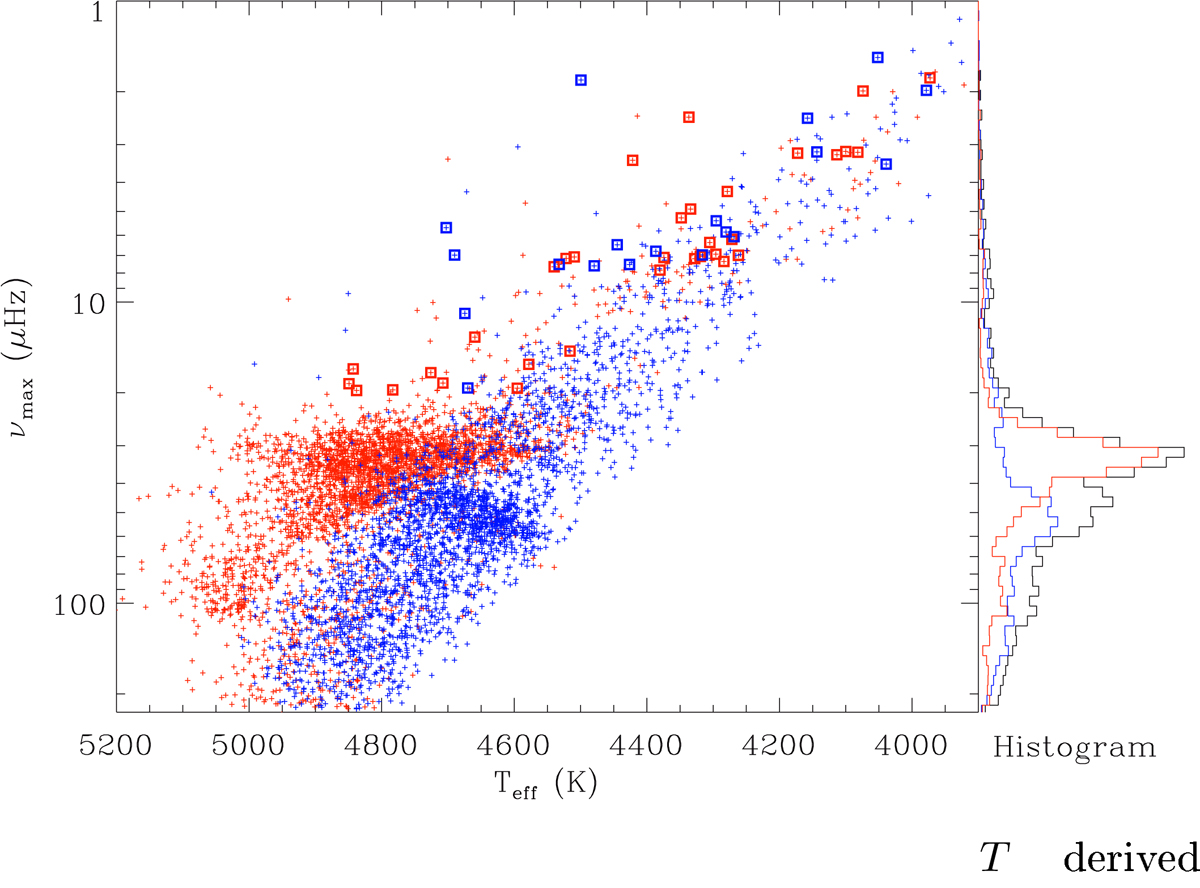
Seismic diagram of the Kepler data, with Teff derived from the APOKASC survey and 1/νmax used as a proxy for the luminosity. Stars identified on the RGB from the η parameter are shown in blue; stars identified as clump stars or on the AGB are plotted in red. Evolved low-mass stars are indicated with squares. The right panel shows the histogram of the stellar distribution as a function of νmax.
Current usage metrics show cumulative count of Article Views (full-text article views including HTML views, PDF and ePub downloads, according to the available data) and Abstracts Views on Vision4Press platform.
Data correspond to usage on the plateform after 2015. The current usage metrics is available 48-96 hours after online publication and is updated daily on week days.
Initial download of the metrics may take a while.