Fig. 5.
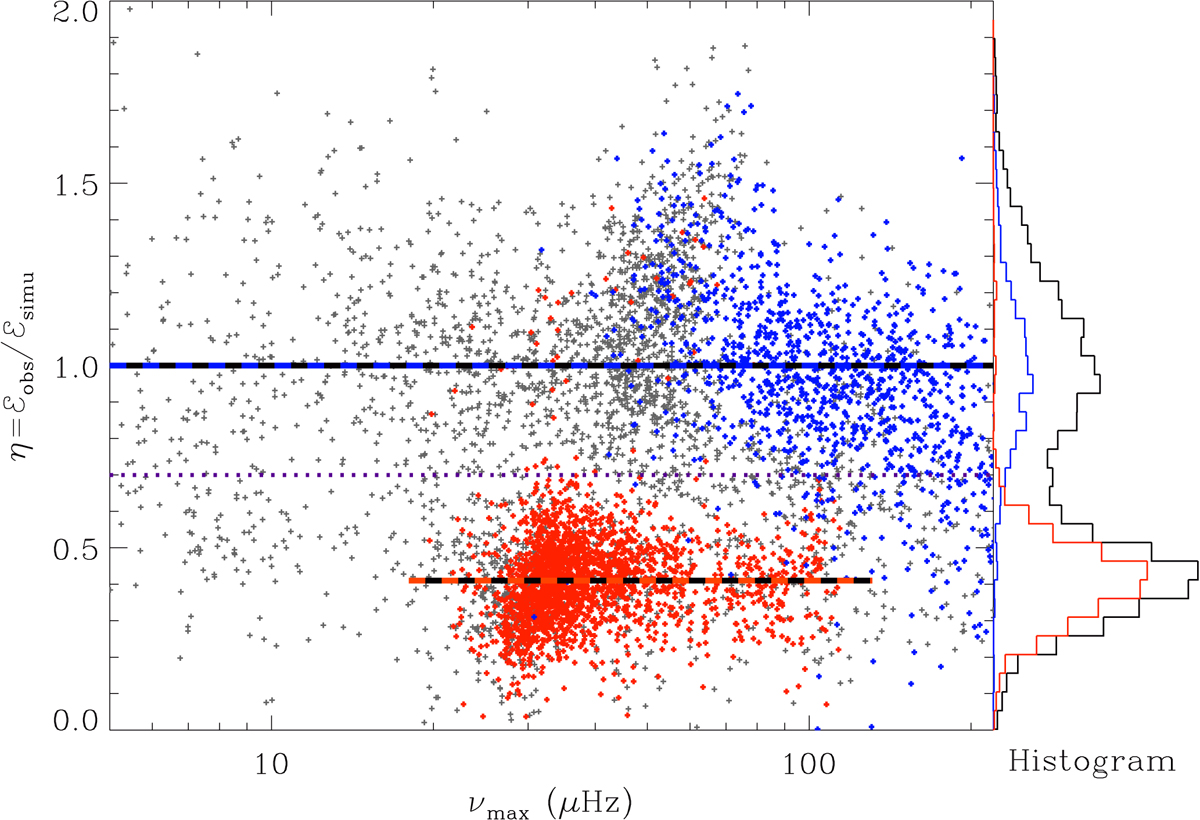
Distribution of the ratio η of the observed EACF compared to the predicted performance (Eq. (7)), for evolved stars. Blue (red) symbols indicate RGB (red clump) stars, as identified by Vrard et al. (2016). The horizontal dashed lines indicate the mean value of the ratio for each evolutionary stage; the dotted line indicates the separation between RGB and RC stars. The right panel shows the bimodal distribution of η.
Current usage metrics show cumulative count of Article Views (full-text article views including HTML views, PDF and ePub downloads, according to the available data) and Abstracts Views on Vision4Press platform.
Data correspond to usage on the plateform after 2015. The current usage metrics is available 48-96 hours after online publication and is updated daily on week days.
Initial download of the metrics may take a while.