Open Access
Fig. 1.
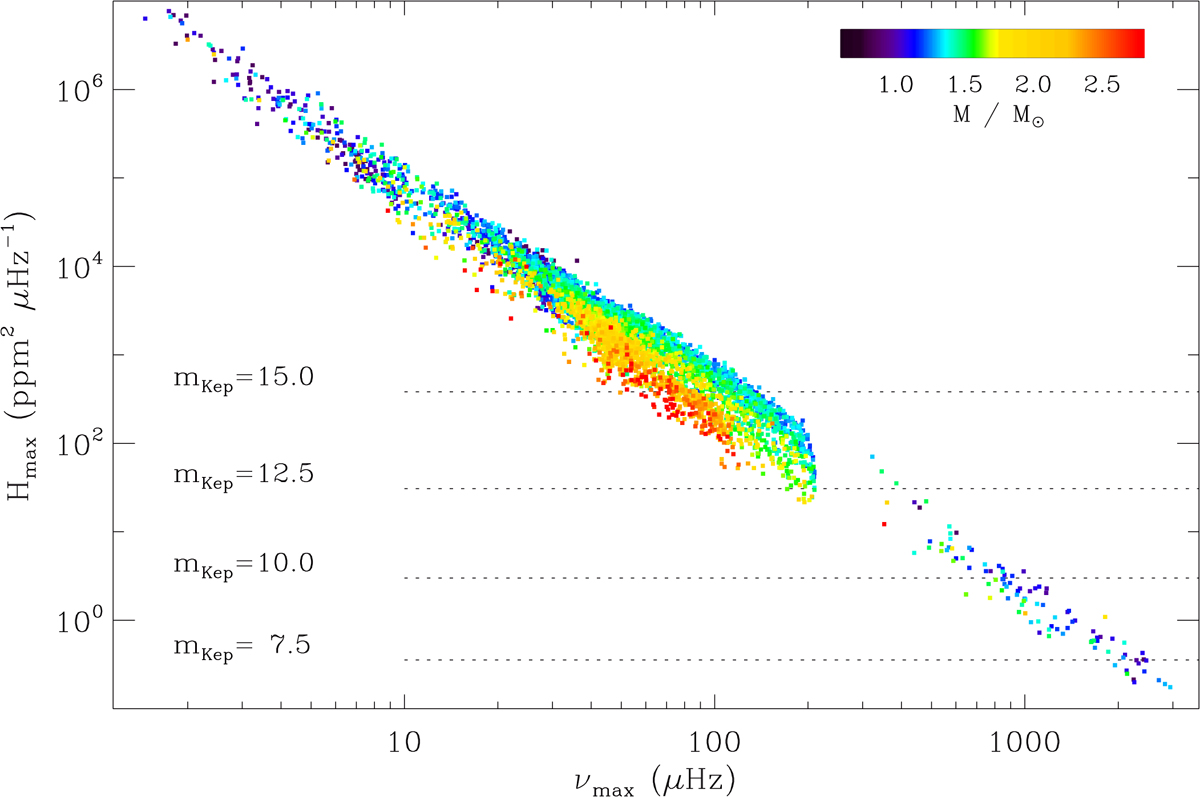
Variation of Hmax as a function of νmax, for stars observed with Kepler. The color code indicates the seismic estimate of the mass. The instrumental and photon noise power spectrum density is also indicated by dotted lines for various stellar magnitudes.
Current usage metrics show cumulative count of Article Views (full-text article views including HTML views, PDF and ePub downloads, according to the available data) and Abstracts Views on Vision4Press platform.
Data correspond to usage on the plateform after 2015. The current usage metrics is available 48-96 hours after online publication and is updated daily on week days.
Initial download of the metrics may take a while.