Free Access
Fig. 1.
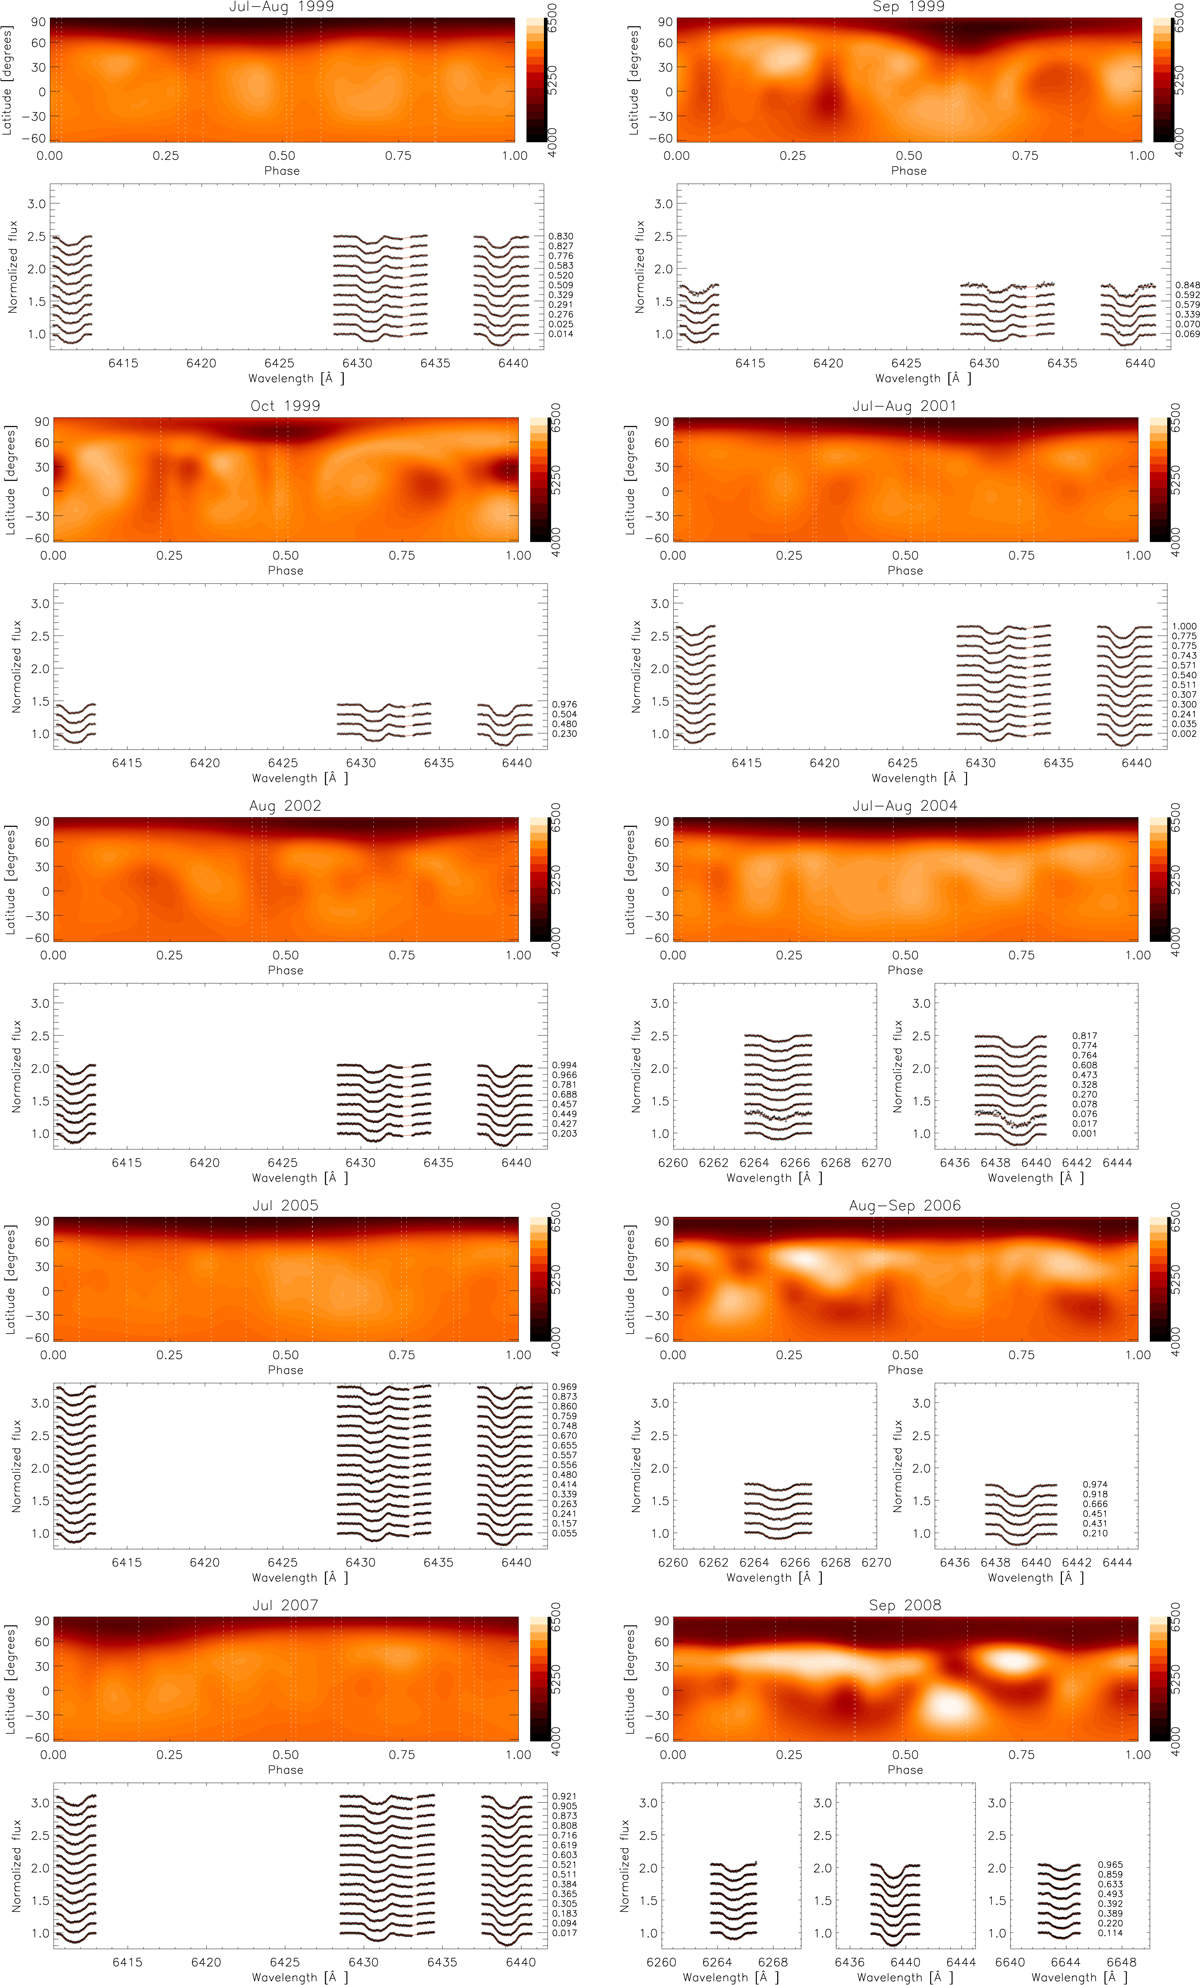
Doppler imaging maps of V889 Her for 1999–2008. Upper panels: equirectangular projections of the surface temperature distribution. The longitude is given as the rotational phase. The vertical lines represent the phases of the individual spectra. Lower panels: observed (black) and modeled (red) line profiles.
Current usage metrics show cumulative count of Article Views (full-text article views including HTML views, PDF and ePub downloads, according to the available data) and Abstracts Views on Vision4Press platform.
Data correspond to usage on the plateform after 2015. The current usage metrics is available 48-96 hours after online publication and is updated daily on week days.
Initial download of the metrics may take a while.