Free Access
Fig. 8.
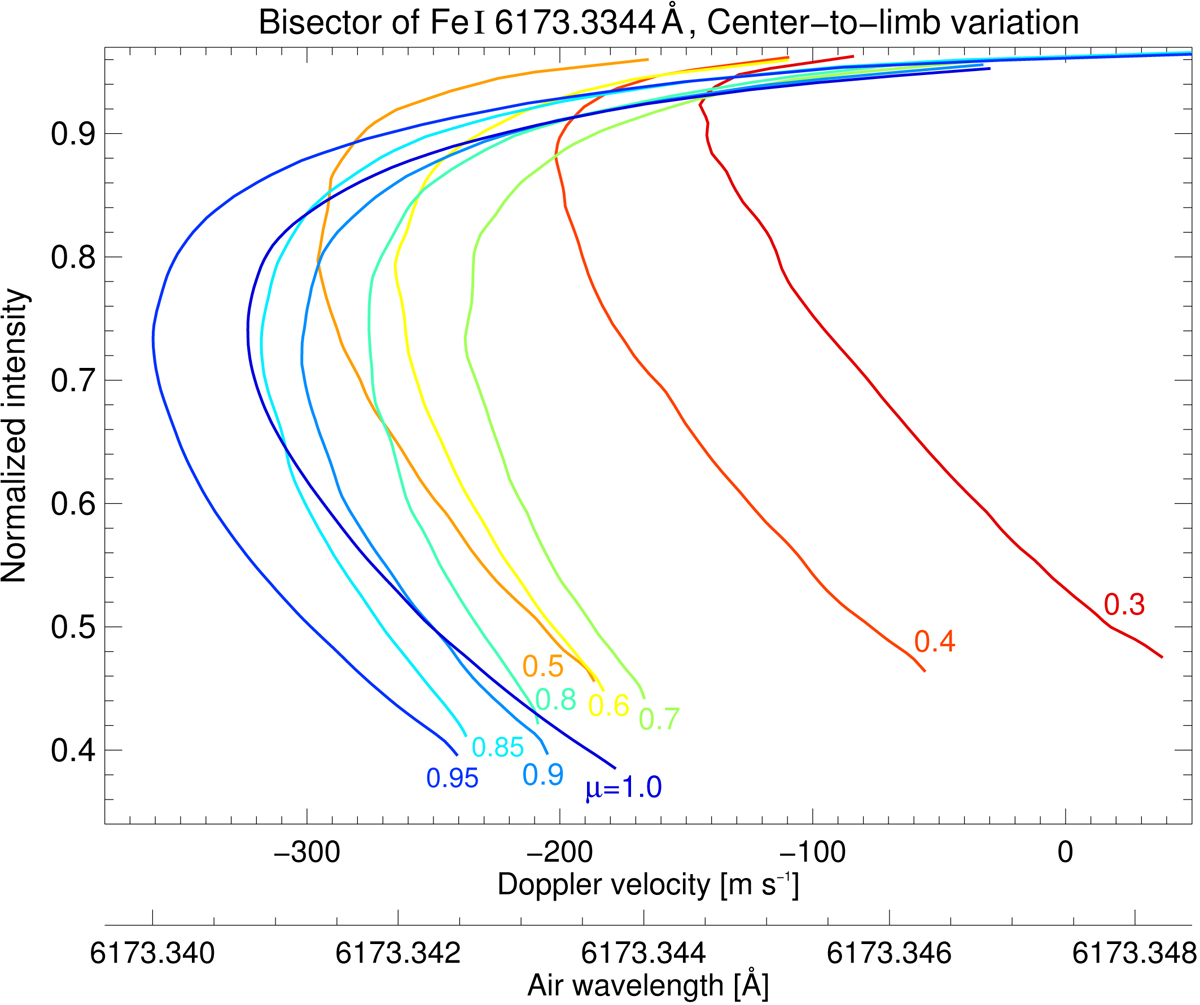
Center-to-limb variation of the bisector profile of Fe I 6173.3 Å from μ = 1.0 (blue curve) toward μ = 0.3 (red curve). The normalized intensity is displayed against the absolute air wavelength and the Doppler velocity. Each curve represents the average bisector for all measurements at the respective heliocentric position.
Current usage metrics show cumulative count of Article Views (full-text article views including HTML views, PDF and ePub downloads, according to the available data) and Abstracts Views on Vision4Press platform.
Data correspond to usage on the plateform after 2015. The current usage metrics is available 48-96 hours after online publication and is updated daily on week days.
Initial download of the metrics may take a while.