Fig. 6.
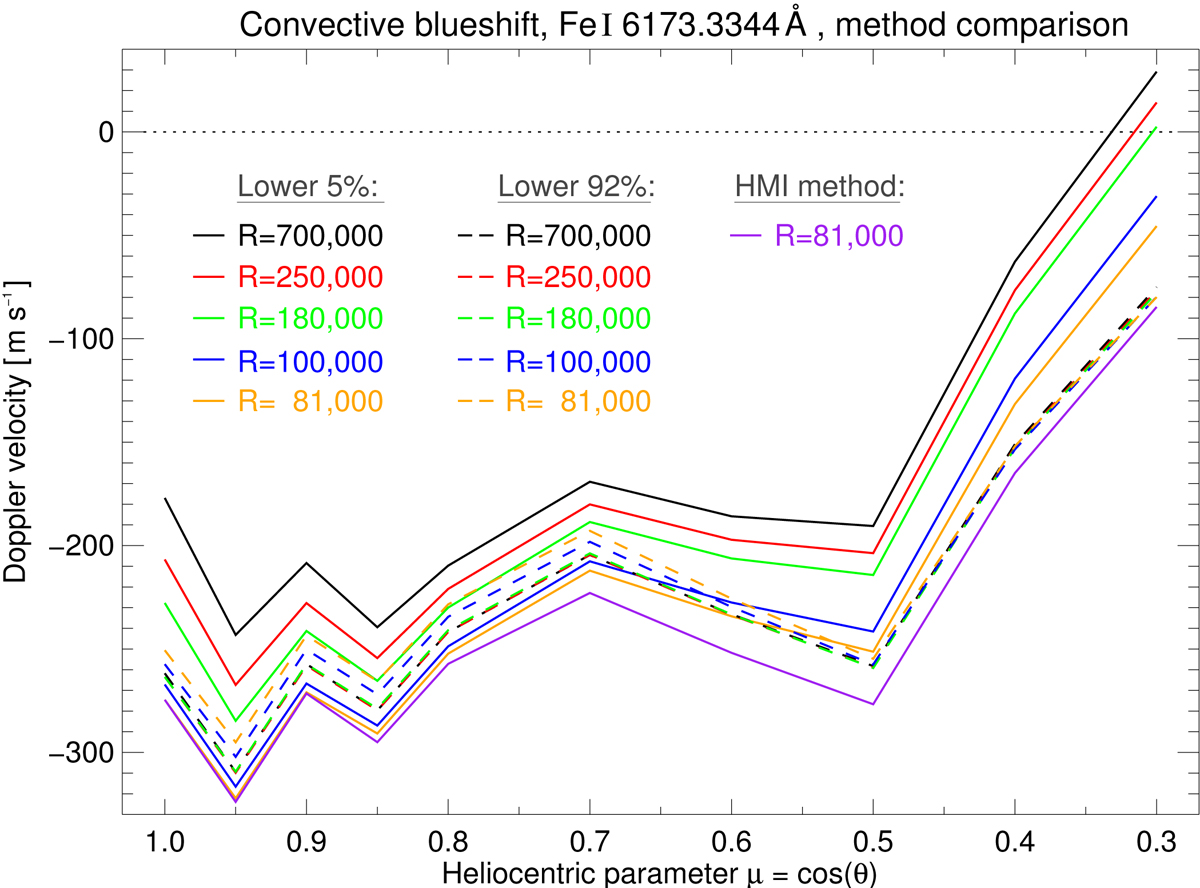
Comparison of the convective blueshift measured with LARS from disk center toward the solar limb on the basis of different spectral resolutions R, line segments, and velocity calibration approaches applied to the original LARS data. The variations of the line core velocity (lower 5% of the bisector) are displayed as solid lines (from black to orange). The variations under consideration of the lower 92% of the line bisector are shown as dashed lines. The variation of Doppler velocities obtained with the HMI approach are drawn as purple solid line.
Current usage metrics show cumulative count of Article Views (full-text article views including HTML views, PDF and ePub downloads, according to the available data) and Abstracts Views on Vision4Press platform.
Data correspond to usage on the plateform after 2015. The current usage metrics is available 48-96 hours after online publication and is updated daily on week days.
Initial download of the metrics may take a while.