Fig. 3.
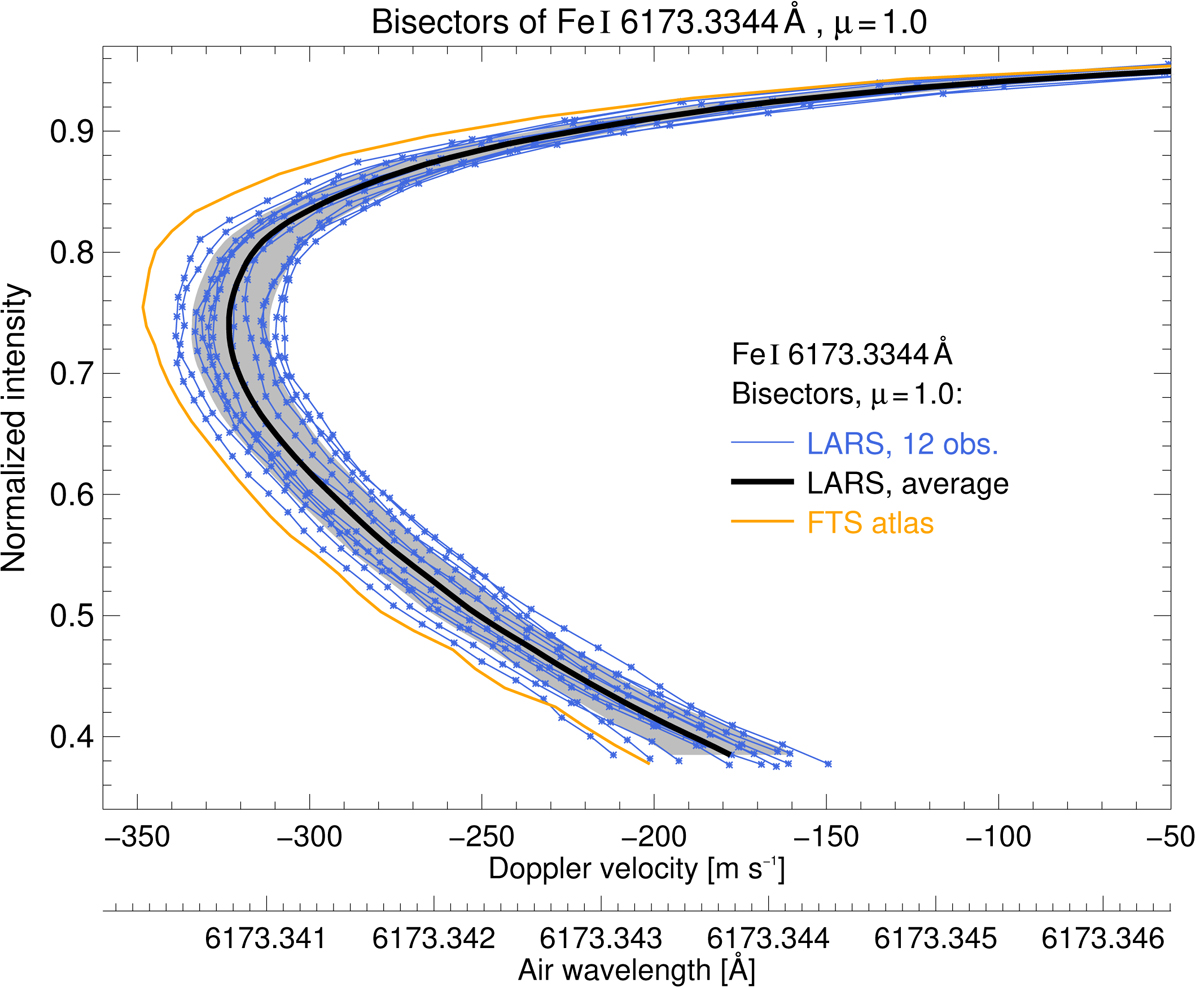
Bisectors of Fe I 6173.3 Å measured at the solar disk center (μ = 1.0). The normalized intensity is displayed against the absolute air wavelength (lower x-axis) and the translated Doppler velocity (upper x-axis). The individual bisectors of 12 observational sequences are shown as blue curves with asterisks. The average bisector (black solid line) and its standard deviation (gray area) are given. The line bisector from the Fourier Transform Spectrometer (FTS, Neckel 1999) disk-center atlas is added in orange.
Current usage metrics show cumulative count of Article Views (full-text article views including HTML views, PDF and ePub downloads, according to the available data) and Abstracts Views on Vision4Press platform.
Data correspond to usage on the plateform after 2015. The current usage metrics is available 48-96 hours after online publication and is updated daily on week days.
Initial download of the metrics may take a while.