Free Access
Fig. 3.
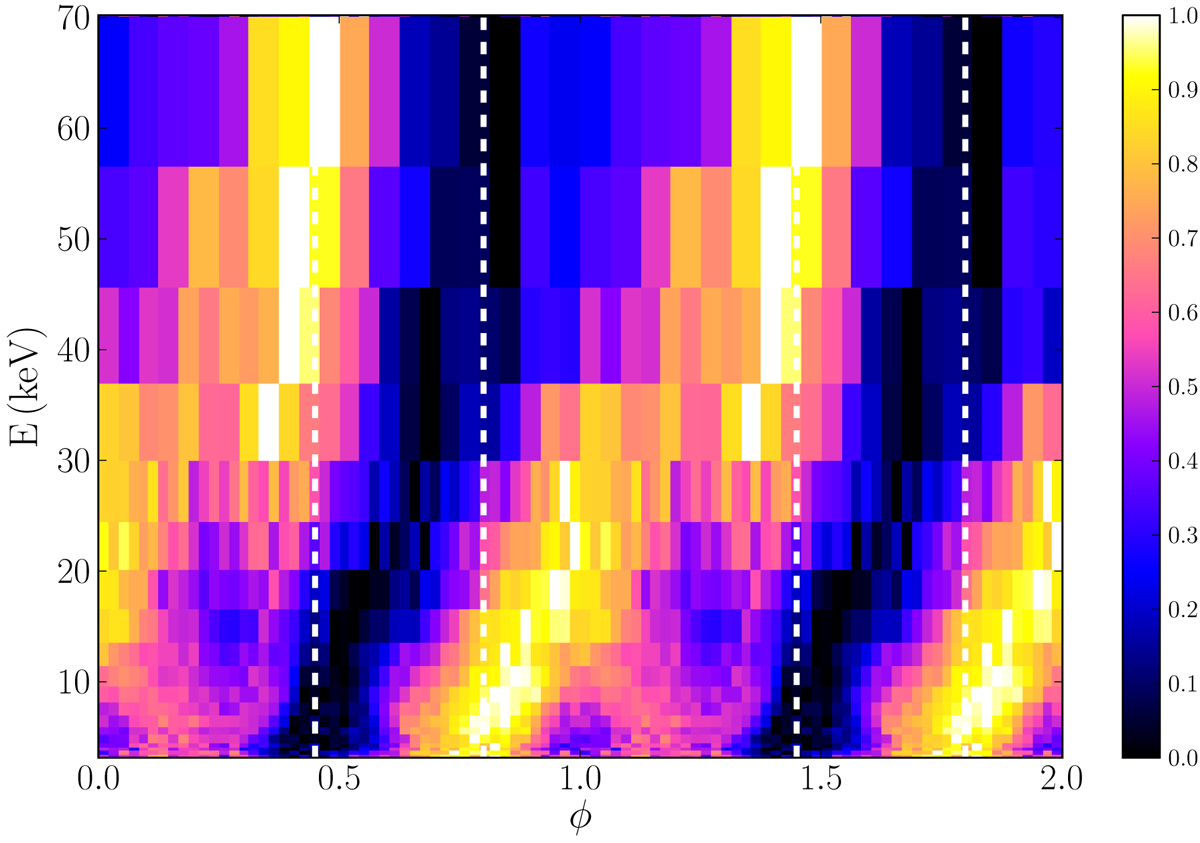
Example of a two-dimensional plot, showing color-coded flux for photon energy versus pulse phase, (for GS 0834-430, Fig. 3 of Miyasaka et al. 2013). Horizontal cuts are pulse profiles for the selected energy range, vertical cuts are spectra for the selected phase interval.
Current usage metrics show cumulative count of Article Views (full-text article views including HTML views, PDF and ePub downloads, according to the available data) and Abstracts Views on Vision4Press platform.
Data correspond to usage on the plateform after 2015. The current usage metrics is available 48-96 hours after online publication and is updated daily on week days.
Initial download of the metrics may take a while.