Fig. 2.
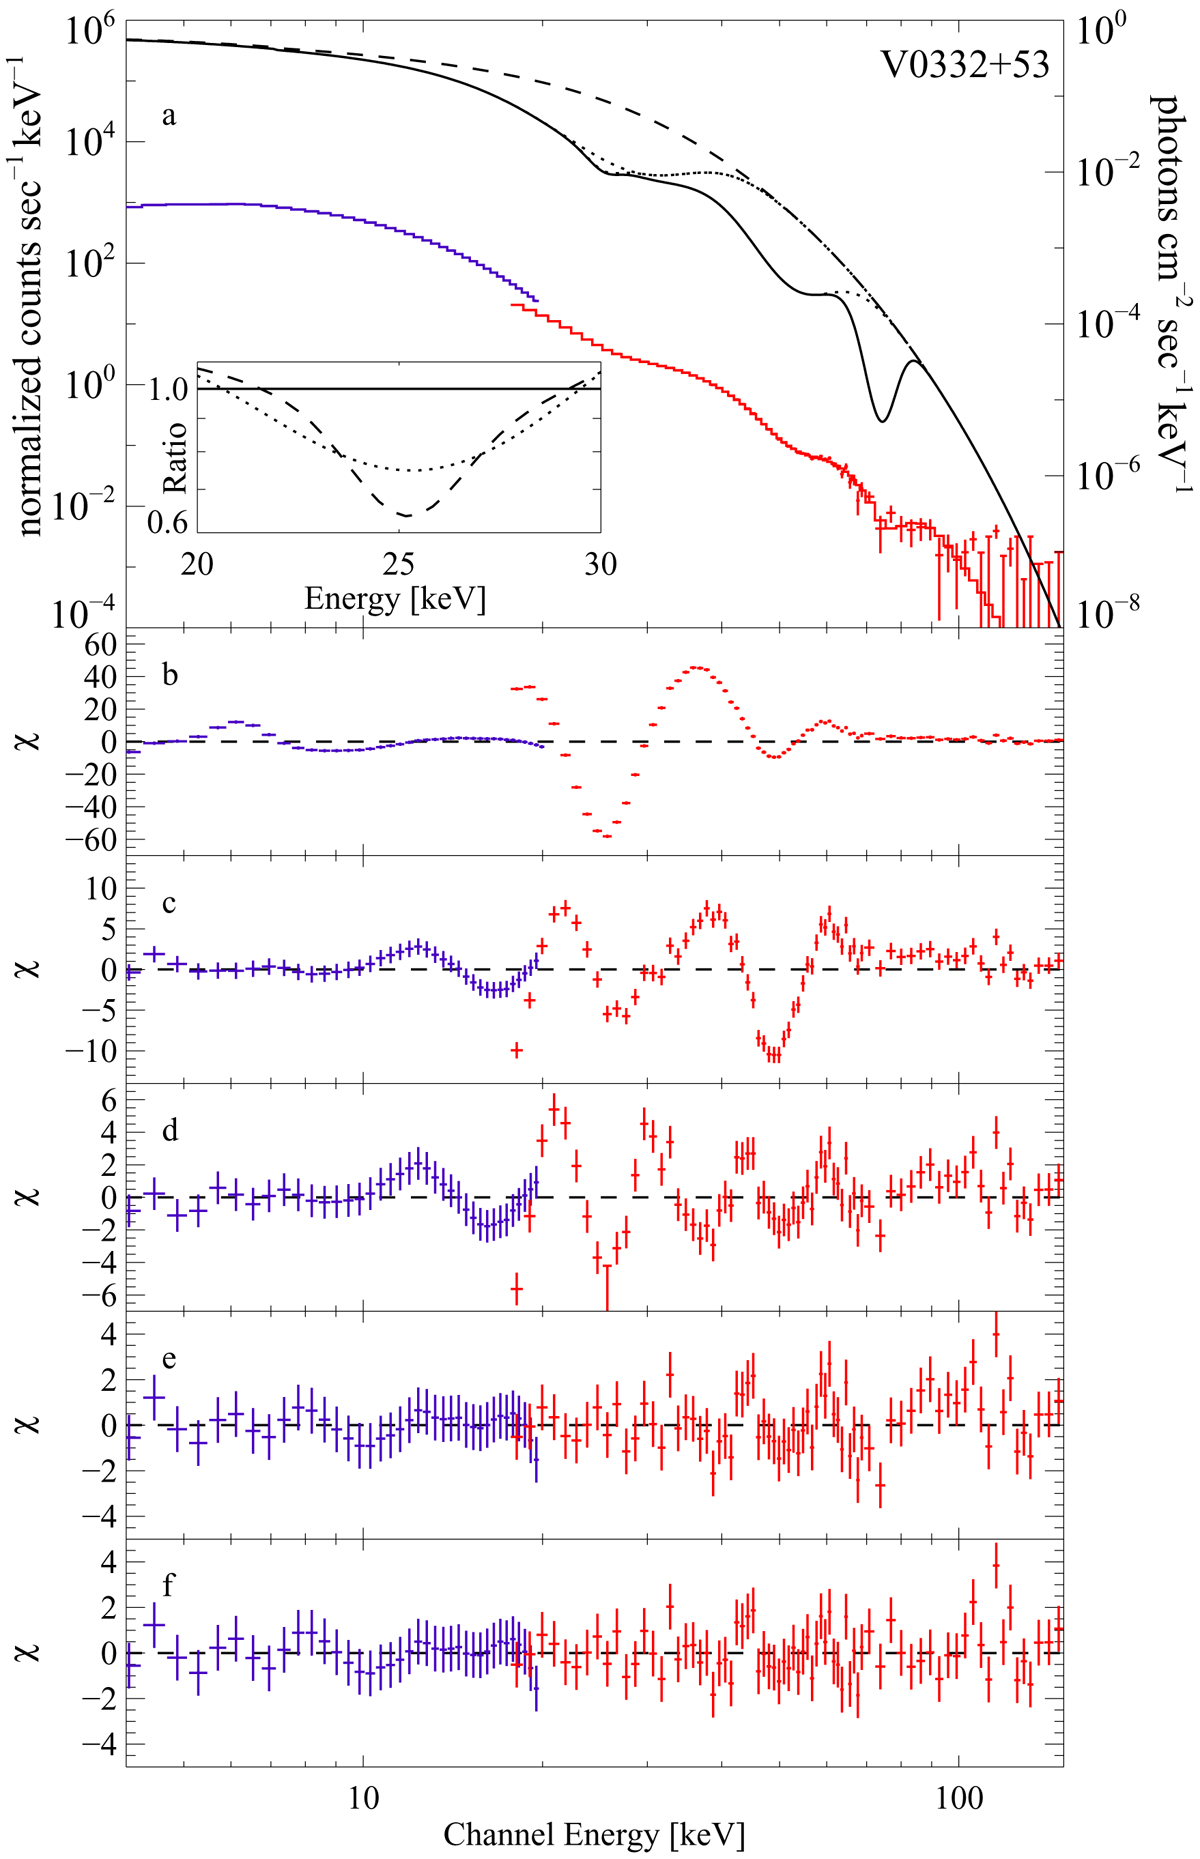
Example of a spectral modeling for continuum plus cyclotron lines. Reproduction of Fig. 2 of Pottschmidt et al. (2005), showing the phase averaged spectrum of V 0332+53 as observed with RXTE for a Fermi–Dirac continuum and up to three cyclotron lines (modeled using the Gaussian optical depth profile gabs). Panel a: combined PCA/HEXTE spectrum (crosses), best-fit model (histogram), and unfolded spectrum (dotted and solid lines, right y-axis label), illustrating the cumulative effect of the CRSFs on the continuum. Panels b–f: residuals for models taking increasing numbers of CRSFs into account: panel b: no line; panel c: one line at 25.5 keV; panel d: two lines, at 25.6 keV and at 50 keV; panel e: two lines: the fundamental line modeled by two Gaussian components at 25.2 keV and 26.6 keV, and its harmonic at 49.9 keV; panel f: three lines, the fundamental modeled by two components at ∼25 keV and ∼27 keV and two harmonics at ∼51 keV and at ∼74 keV. For further explanation see Pottschmidt et al. (2005).
Current usage metrics show cumulative count of Article Views (full-text article views including HTML views, PDF and ePub downloads, according to the available data) and Abstracts Views on Vision4Press platform.
Data correspond to usage on the plateform after 2015. The current usage metrics is available 48-96 hours after online publication and is updated daily on week days.
Initial download of the metrics may take a while.