Fig. 5
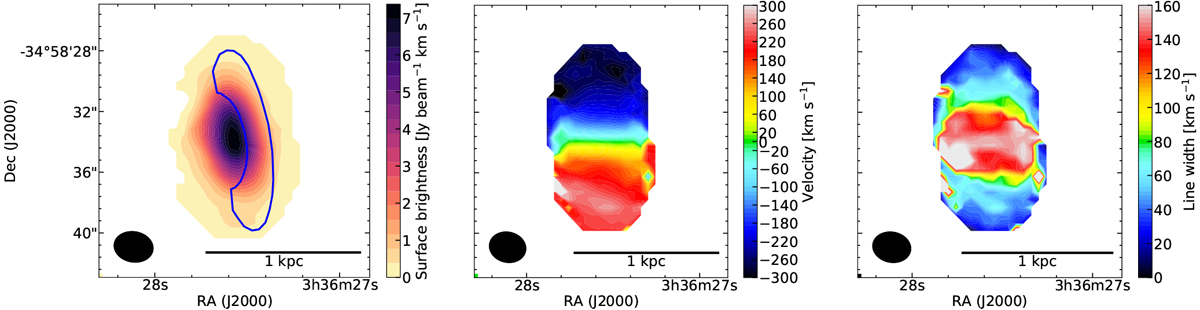
Moment maps of the CO(1-0) line observations with ALMA. Left panel: total line intensity with the region of the dust lane overlaid. Middle panel: velocity map indicating a regular rotation. Right panel: linewidth map (which peaks in the centre owing to beam smearing). The size of the ALMA beam is shown in each frame as a black ellipse.
Current usage metrics show cumulative count of Article Views (full-text article views including HTML views, PDF and ePub downloads, according to the available data) and Abstracts Views on Vision4Press platform.
Data correspond to usage on the plateform after 2015. The current usage metrics is available 48-96 hours after online publication and is updated daily on week days.
Initial download of the metrics may take a while.