Free Access
Fig. 3
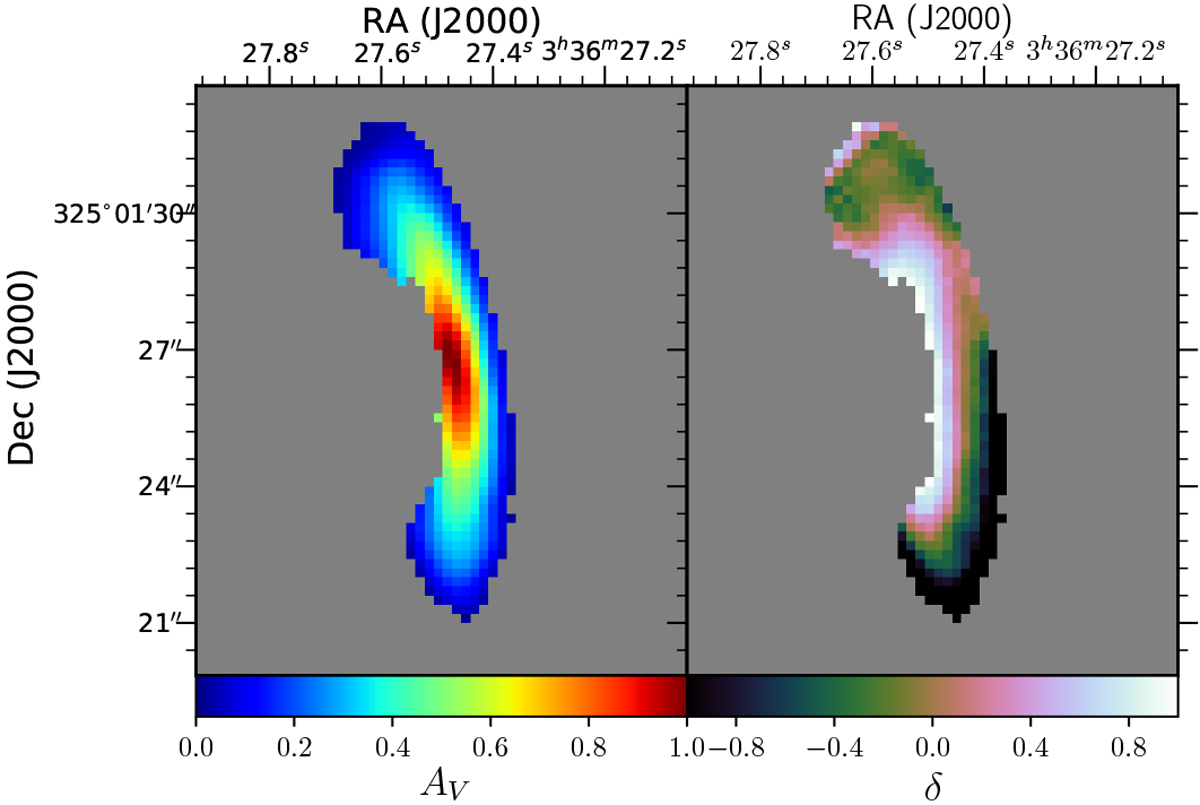
Parameter maps for the fitted pixel-by-pixel attenuation curves. Left panel: V -band attenuation AV. Right panel: slope parameter δ, where steeper slopes are associated with more negative δ and a Calzetti-like attenuation curve has δ = 0.
Current usage metrics show cumulative count of Article Views (full-text article views including HTML views, PDF and ePub downloads, according to the available data) and Abstracts Views on Vision4Press platform.
Data correspond to usage on the plateform after 2015. The current usage metrics is available 48-96 hours after online publication and is updated daily on week days.
Initial download of the metrics may take a while.