Fig. 7.
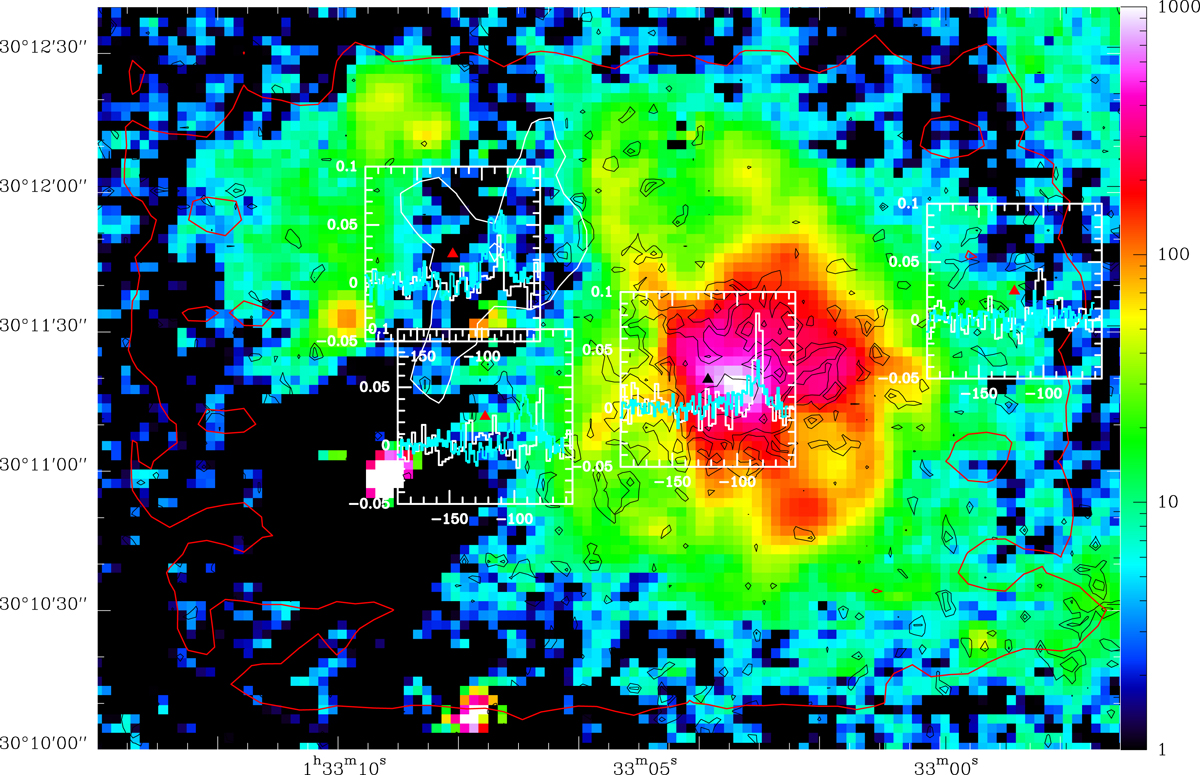
Southern field Hα emission in color, with 100 μm PACS emission in black contours. Four CO spectra in the southern field where the signal is well above the noise are shown, with the precise positions indicated with red or black triangles. The 21 cm spectrum at the location of the detected CO line is shown in cyan. The thick red contour indicates the extent of the CO map. The white contour between the Hα emitting zones shows the NHI = 1.8 × 1021 cm−2 column density level (in the rest of the region, the HI column densities are lower than the contour value).
Current usage metrics show cumulative count of Article Views (full-text article views including HTML views, PDF and ePub downloads, according to the available data) and Abstracts Views on Vision4Press platform.
Data correspond to usage on the plateform after 2015. The current usage metrics is available 48-96 hours after online publication and is updated daily on week days.
Initial download of the metrics may take a while.