Fig. 5.
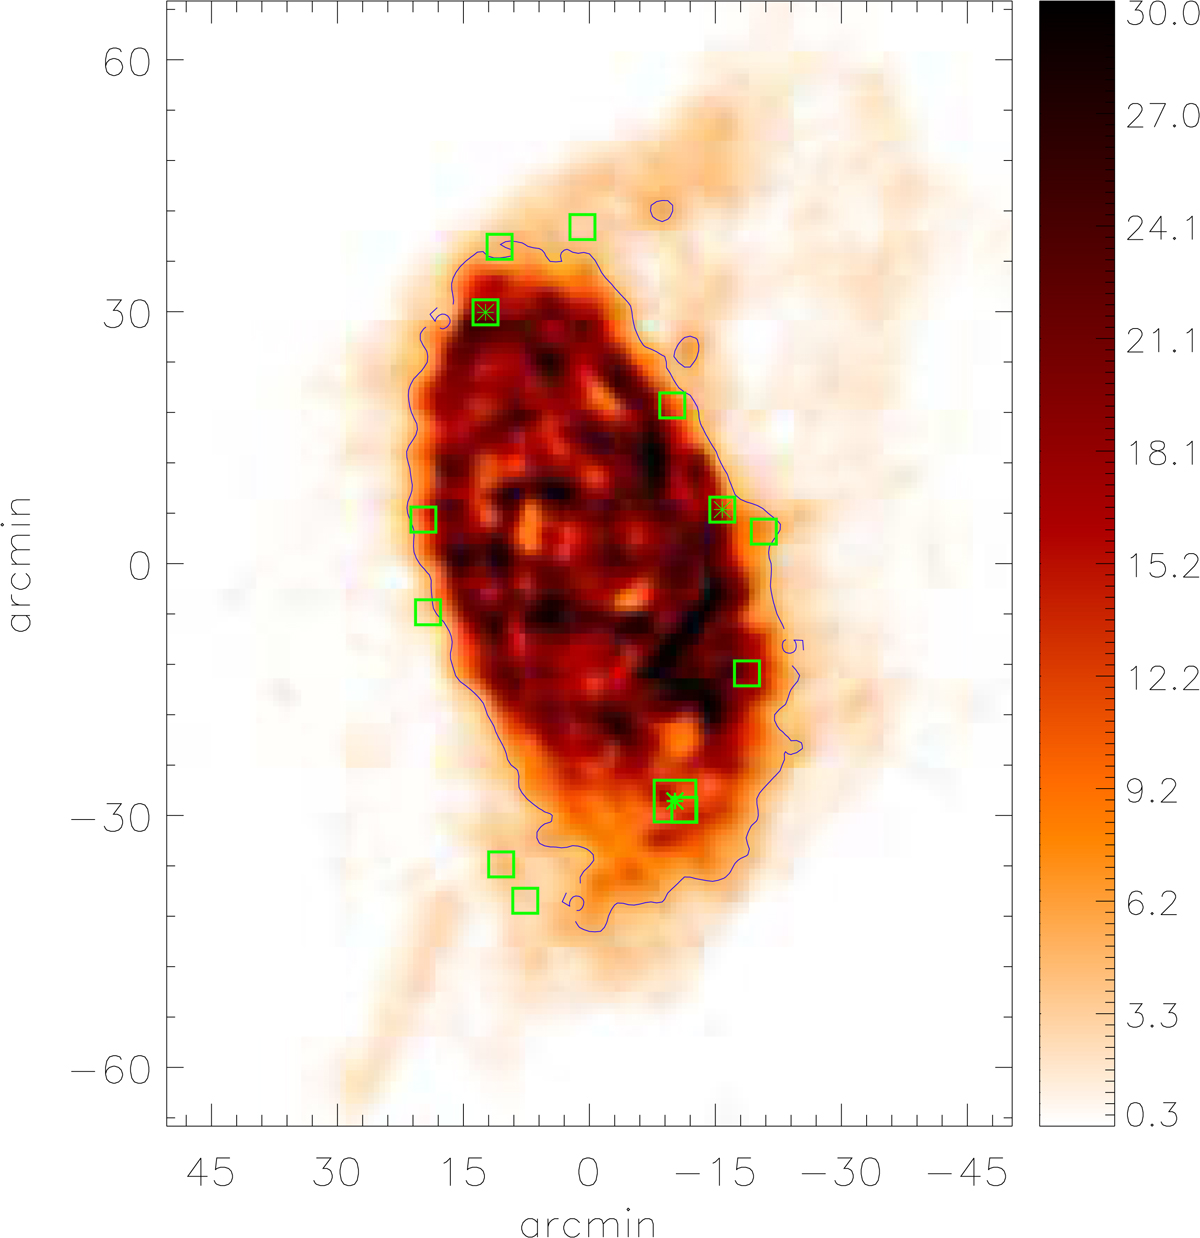
Location of sources in the MIR-selected sample (open squares) plotted over the 21 cm map of M 33. Asterisks indicate the location of MIR sources where CO has been detected. The color bar and map unit are Jy beam−1 km s−1; a 130 arcsec beam has been used for this smoothed 21 cm map. The dark contour level at 5 Jy beam−1 km s−1 corresponds to a face-on HI column density of about 2 × 1020 cm−2.
Current usage metrics show cumulative count of Article Views (full-text article views including HTML views, PDF and ePub downloads, according to the available data) and Abstracts Views on Vision4Press platform.
Data correspond to usage on the plateform after 2015. The current usage metrics is available 48-96 hours after online publication and is updated daily on week days.
Initial download of the metrics may take a while.