Fig. 4.
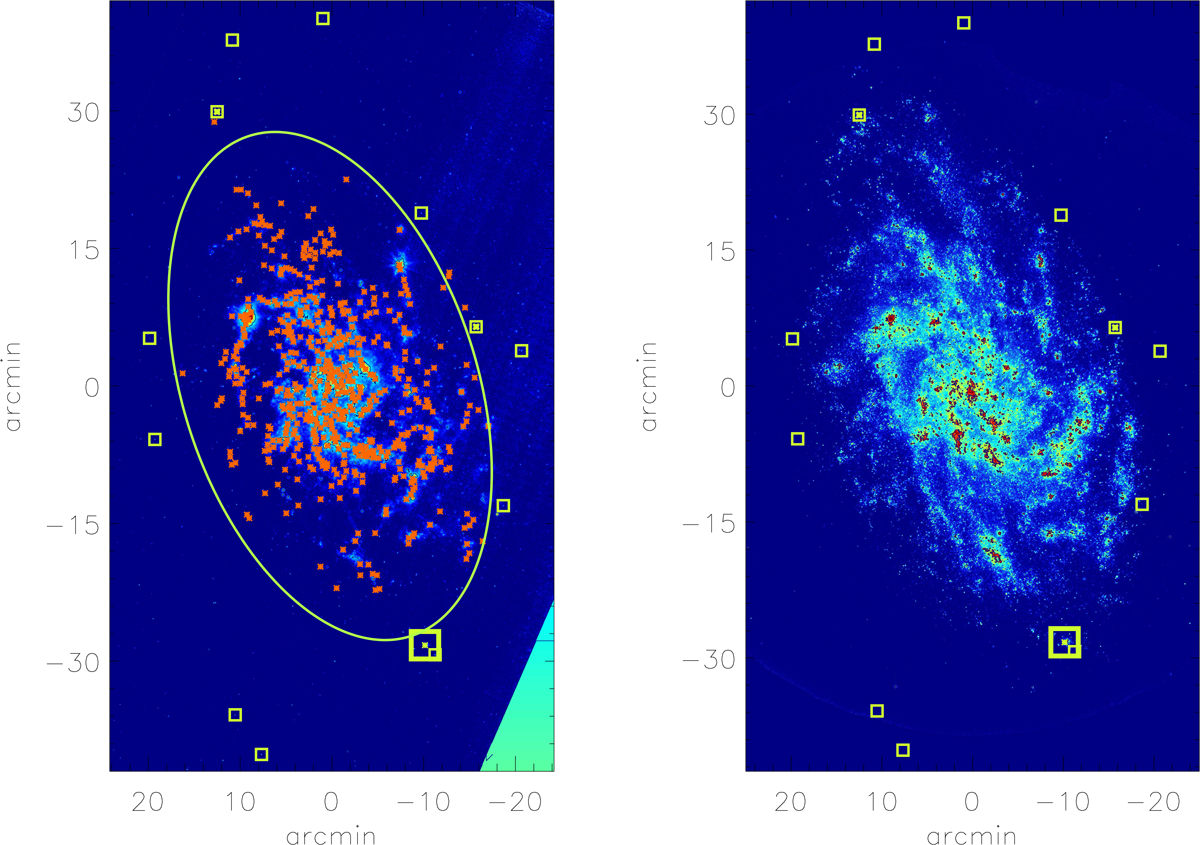
GMCs detected through the all-disk IRAM survey are plotted with orange asterisks over the 24 μm image of M 33 in the left panel. The ellipse encloses the SF disk, with a radius of 7 kpc, mapped in the CO J = 2−1 line by the IRAM all-disk survey. Small open squares indicate the selected MIR sources for the deeper CO pointed observations described in this paper, and the large open square indicates the mapped southern field. Asterisks inside open squares highlight the location of the new detected molecular clouds presented in this paper. They are plotted over the 24 μm image of M 33 in the left panel and over the FUV-GALEX image of M 33 in the right panel.
Current usage metrics show cumulative count of Article Views (full-text article views including HTML views, PDF and ePub downloads, according to the available data) and Abstracts Views on Vision4Press platform.
Data correspond to usage on the plateform after 2015. The current usage metrics is available 48-96 hours after online publication and is updated daily on week days.
Initial download of the metrics may take a while.