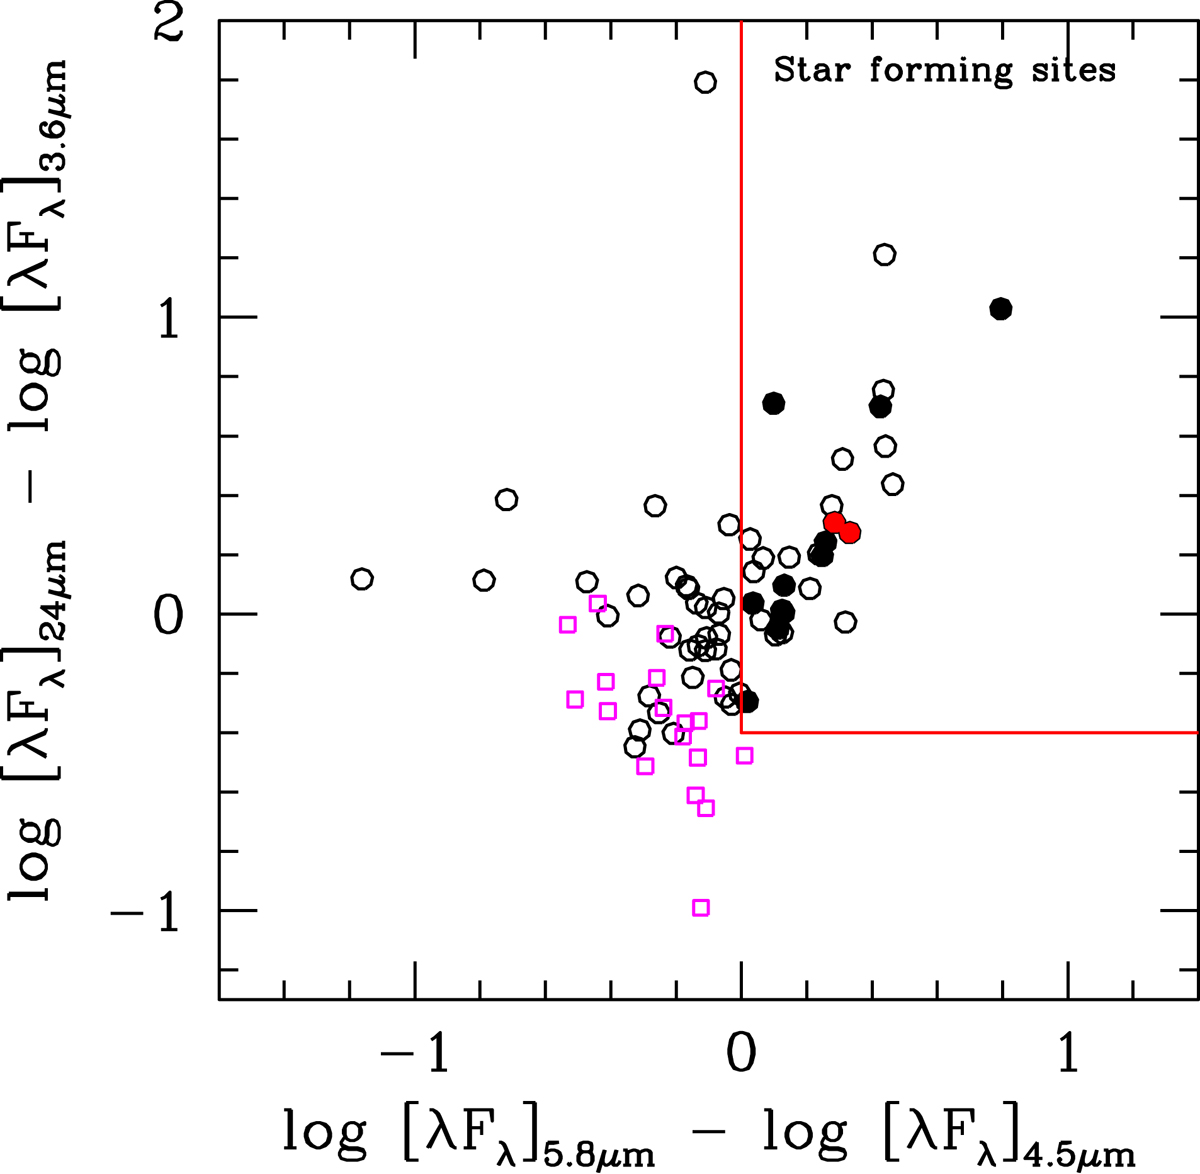
Fig. 3.

Colors or differences in energy densities at two wavelengths for MIR sources in the catalog of Sharma et al. (2011) that are at galactocentric distances between 7.5 and 10.8 kpc. The red box selects 30 MIR sources that are likely to be YSCCs. The filled symbols indicate the YSCCs selected for pilot observations of the CO J = 1−0 and J = 2−1 lines presented in this paper. Filled red symbols show the two YSCCs where the CO lines have been detected. The open magenta squares indicate the location of MIR sources that optically appear as background disk galaxies.
Current usage metrics show cumulative count of Article Views (full-text article views including HTML views, PDF and ePub downloads, according to the available data) and Abstracts Views on Vision4Press platform.
Data correspond to usage on the plateform after 2015. The current usage metrics is available 48-96 hours after online publication and is updated daily on week days.
Initial download of the metrics may take a while.


