Fig. 11.
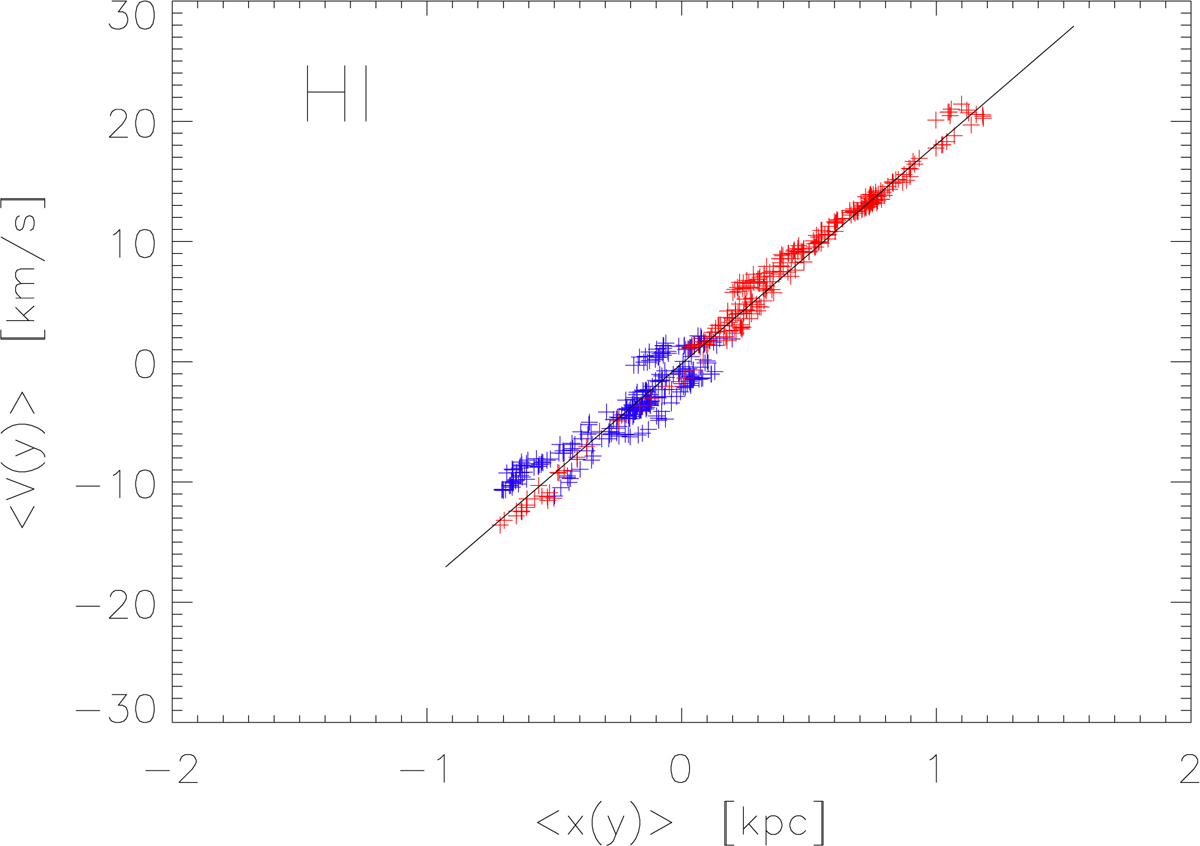
Intensity-weighted mean line-of-sight HI velocity defined by Eq. (2) vs. the intensity-weighted mean position defined by Eq. (3). Each point represents a different horizontal strip in the moment images, at distance y from the major axis. In red we show data from the far side to the east of the major axis, and in blue we plot data from the near side, to the west of major axis. The solid line is the fitted regression, whose slope gives ΩP × sin i.
Current usage metrics show cumulative count of Article Views (full-text article views including HTML views, PDF and ePub downloads, according to the available data) and Abstracts Views on Vision4Press platform.
Data correspond to usage on the plateform after 2015. The current usage metrics is available 48-96 hours after online publication and is updated daily on week days.
Initial download of the metrics may take a while.