Fig. 6.
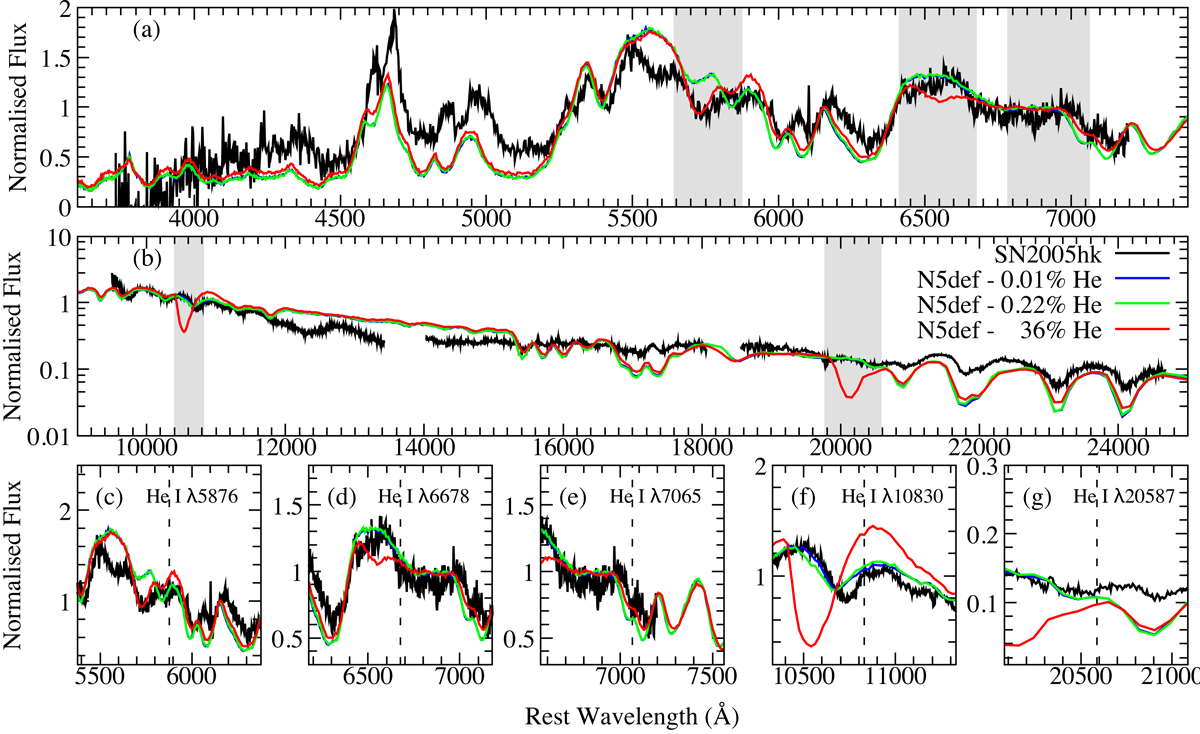
Comparison of SN 2005hk and our N5def models with 0.01%, 0.22%, and 36% helium abundances. Optical and infrared spectra have been normalised to the median flux from 5000 Å–7000 Å and 10 000 Å –12 000 Å, respectively. The optical and infrared spectra of SN 2005hk are approximately +13 days after B-band maximum and have been corrected for galactic extinction only. Our N5def model is shown at +15 days after bolometric maximum light. Panels a and b: shaded regions represent He I λ5876, λ6678, λ7065, λ10830, and λ20587 at rest and blue-shifted by the maximum velocity of the model (∼12 300 km s−1). Panels c–g: zoom-ins of the regions surrounding He I λ5876, λ6678, λ7065, λ10830, and λ20587, respectively. Rest wavelengths are denoted by a vertical dashed line.
Current usage metrics show cumulative count of Article Views (full-text article views including HTML views, PDF and ePub downloads, according to the available data) and Abstracts Views on Vision4Press platform.
Data correspond to usage on the plateform after 2015. The current usage metrics is available 48-96 hours after online publication and is updated daily on week days.
Initial download of the metrics may take a while.