Fig. A.2.
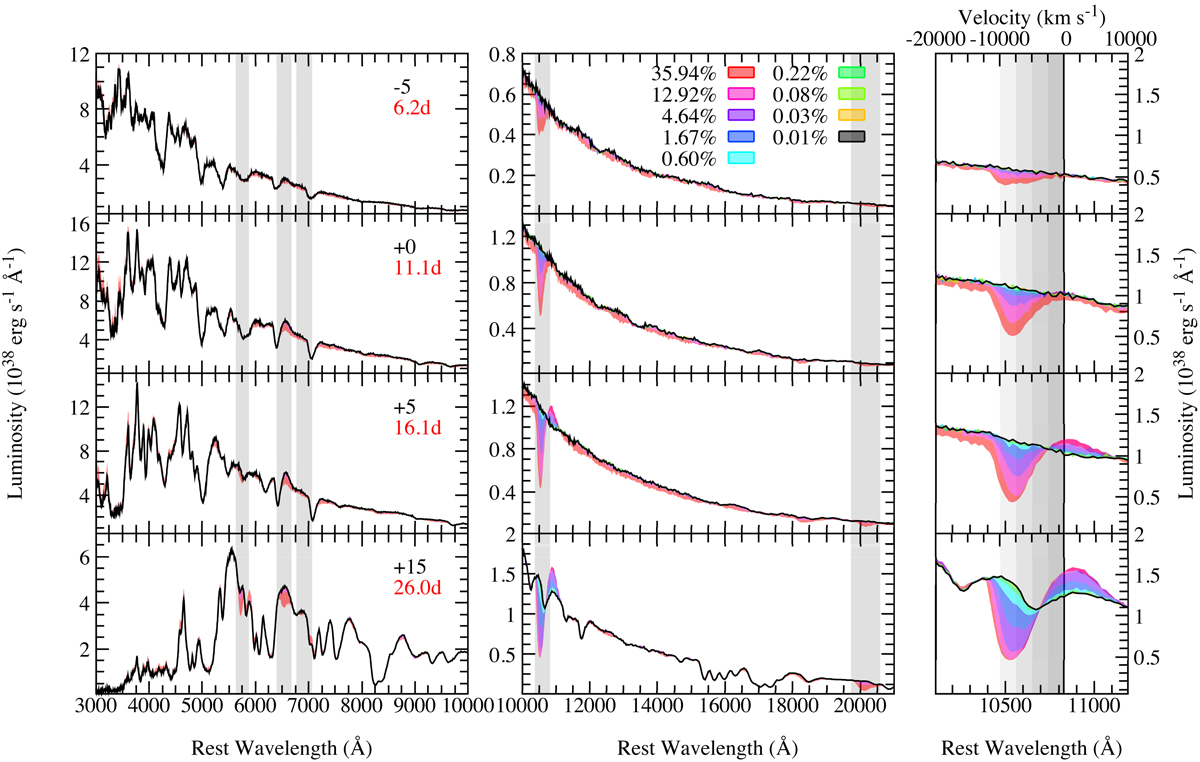
N10def model spectra at various epochs, with varying helium abundances given as percentages of ejecta mass. Shaded regions show the difference produced in the spectra by varying the helium abundance. Phases relative to bolometric maximum light are given in black, while times since explosion are given in red. Left panel: grey shaded regions represent He I λ5876, λ6678, λ7065, λ10830, and λ20587 at rest and blue-shifted by the maximum velocity of the model (∼12 700 km s−1). Right panel: zoomed in regions surrounding He I λ10830. Each shaded region corresponds to a blue-shift of 2500 km s−1.
Current usage metrics show cumulative count of Article Views (full-text article views including HTML views, PDF and ePub downloads, according to the available data) and Abstracts Views on Vision4Press platform.
Data correspond to usage on the plateform after 2015. The current usage metrics is available 48-96 hours after online publication and is updated daily on week days.
Initial download of the metrics may take a while.