Fig. 8
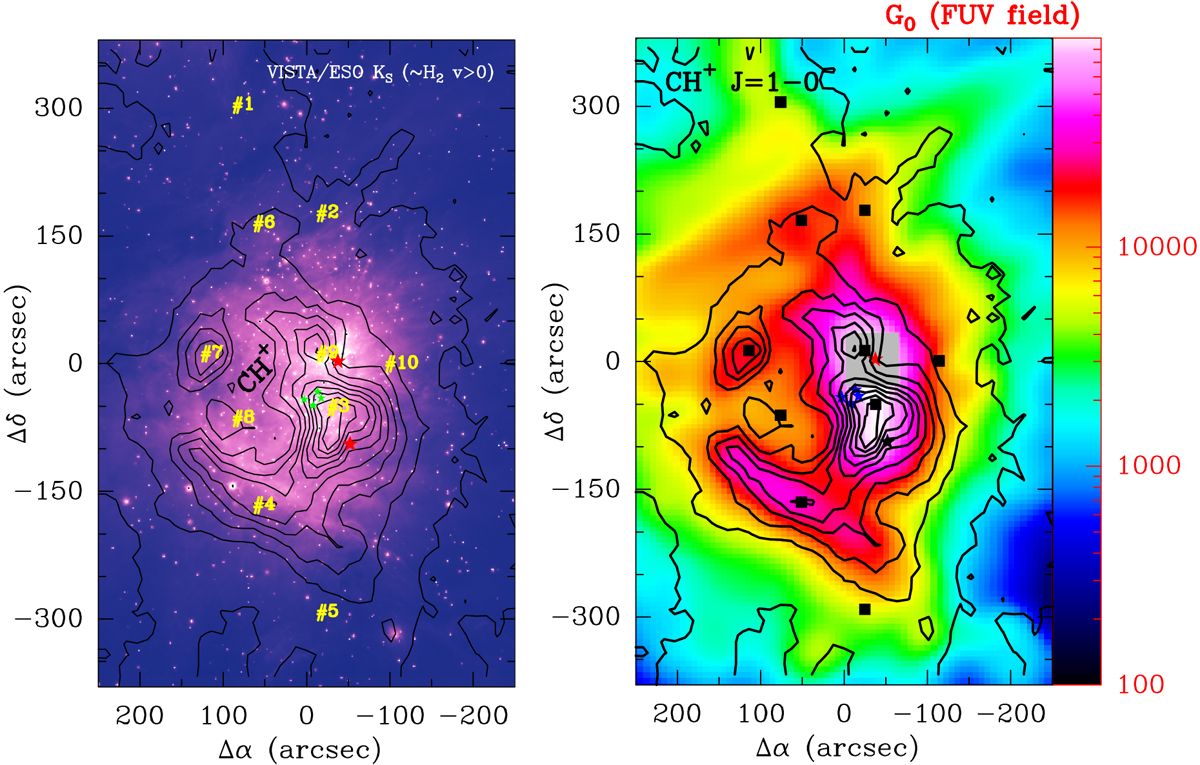
Left panel: NIR VISTA image of M42 in the KS band dominated by interstellar emission from vibrationally excited H2. The intensity scale is chosen to enhance the very bright NIR emission from gas illuminated by the strong FUV field from the Trapezium stars; and locally by thermally excited shocked gas in outflows (Fig. B.6 shows a larger image that enhances the much more extended NIR emission). Black contours show the CH+ J = 1–0 intensities from 1 to 46 K km s−1 in steps of 5 K km s−1. Right panel: FUV radiation field, G0, estimated from FIR luminosities (Goicoechea et al. 2015a). The gray area around BN/KL indicates positions where the Herschel photometric data is saturated.
Current usage metrics show cumulative count of Article Views (full-text article views including HTML views, PDF and ePub downloads, according to the available data) and Abstracts Views on Vision4Press platform.
Data correspond to usage on the plateform after 2015. The current usage metrics is available 48-96 hours after online publication and is updated daily on week days.
Initial download of the metrics may take a while.