Fig. 6
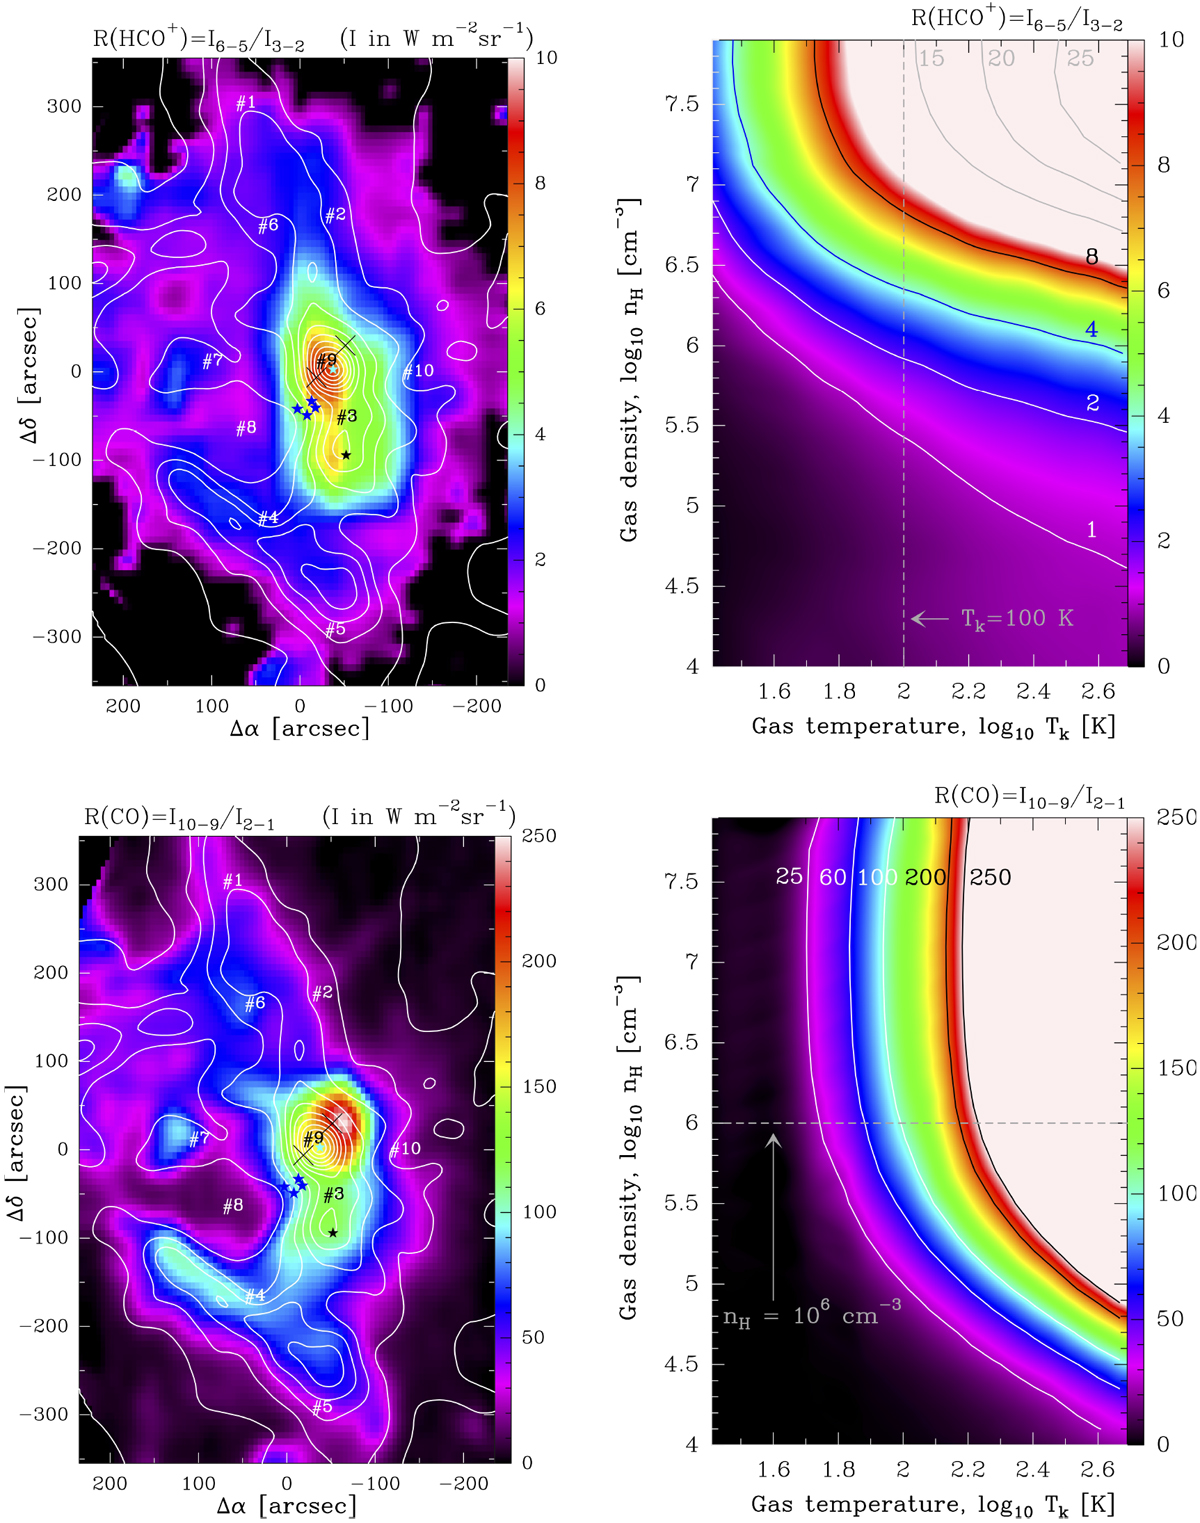
Top left panel: map of the HCO+ 6–5/3–2 intensity ratio, at 43′′ resolution, sensitive to gas density variations. Bottom left panel: map of the CO 10–9/2–1 intensity ratio, at 27′′ resolution, sensitive to gas temperature variations. In both maps the white contours represent the 13CO J = 2–1 optically thin emission. Right panel: grid of non-local and non-LTE excitation models and predicted line intensity ratios.
Current usage metrics show cumulative count of Article Views (full-text article views including HTML views, PDF and ePub downloads, according to the available data) and Abstracts Views on Vision4Press platform.
Data correspond to usage on the plateform after 2015. The current usage metrics is available 48-96 hours after online publication and is updated daily on week days.
Initial download of the metrics may take a while.