Fig. 5
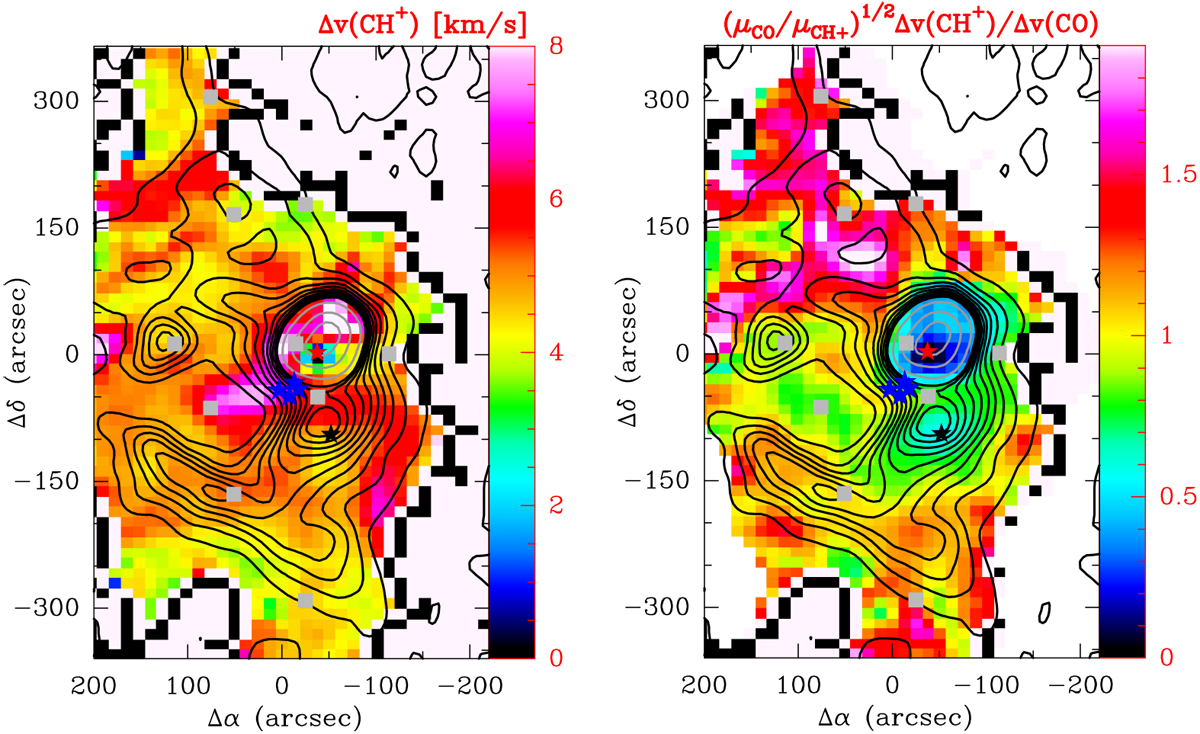
Left panel: map of the CH+ J = 1–0 linewidths inkm s−1 shown in color scale. Right panel: map of the CH+ (J = 1–0) to CO (J = 10–9) linewidth ratio, in color scale, corrected by the different molecular masses. In both panels, black and gray contours show the CO J = 10–9 line integrated intensity. All maps were convolved to the same 27′′ angular resolution.
Current usage metrics show cumulative count of Article Views (full-text article views including HTML views, PDF and ePub downloads, according to the available data) and Abstracts Views on Vision4Press platform.
Data correspond to usage on the plateform after 2015. The current usage metrics is available 48-96 hours after online publication and is updated daily on week days.
Initial download of the metrics may take a while.