Fig. 2
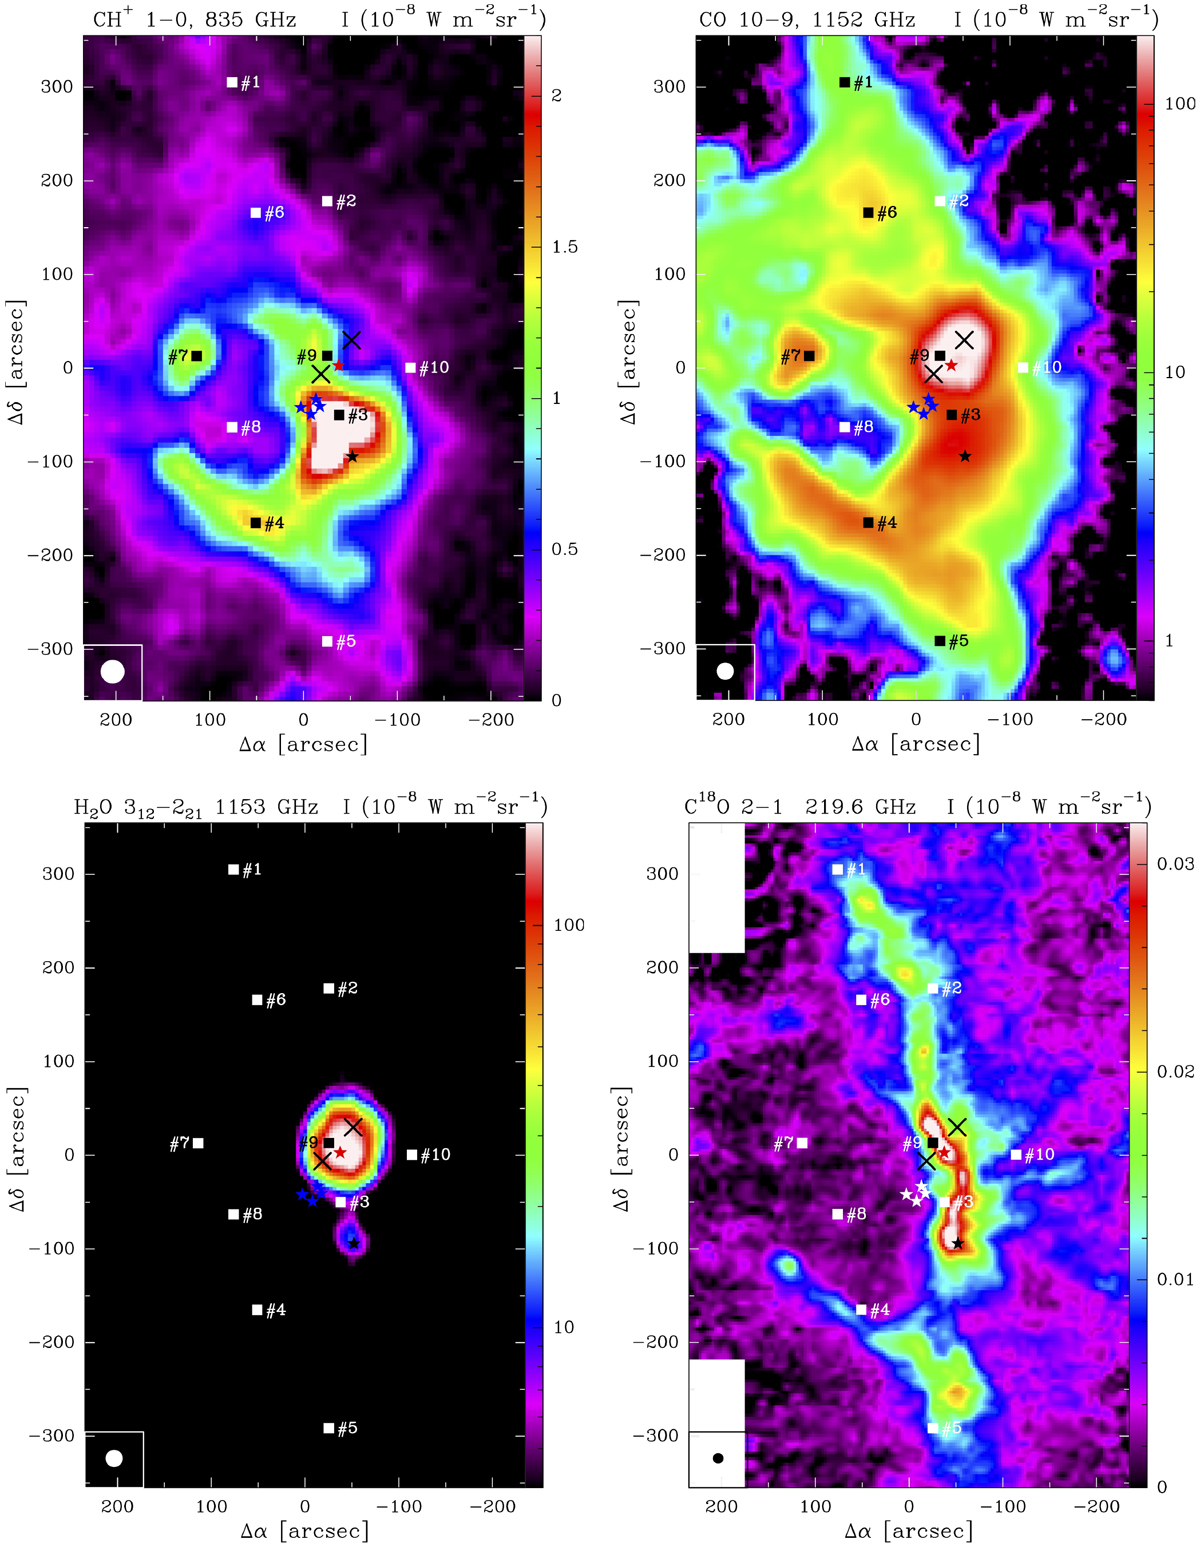
Herschel/HIFI and IRAM 30m maps of different molecular emission lines toward OMC-1, all showing very different spatial distributions: CH+ J = 1–0 (strongly FUV-irradiated gas), CO J = 10–9 (extended warm gas), H2O 312 -221 (hot shockedgas), and C18O J = 2–1 (colder and more FUV-shielded molecular gas). The color scale shows the integrated line intensity in units of W m−2 sr−1. The native angular resolution of each observation, the HPBW, is plotted in the bottom-left corner. Representative positions discussed in the text are indicated with numbers.
Current usage metrics show cumulative count of Article Views (full-text article views including HTML views, PDF and ePub downloads, according to the available data) and Abstracts Views on Vision4Press platform.
Data correspond to usage on the plateform after 2015. The current usage metrics is available 48-96 hours after online publication and is updated daily on week days.
Initial download of the metrics may take a while.