Free Access
Fig. C.1
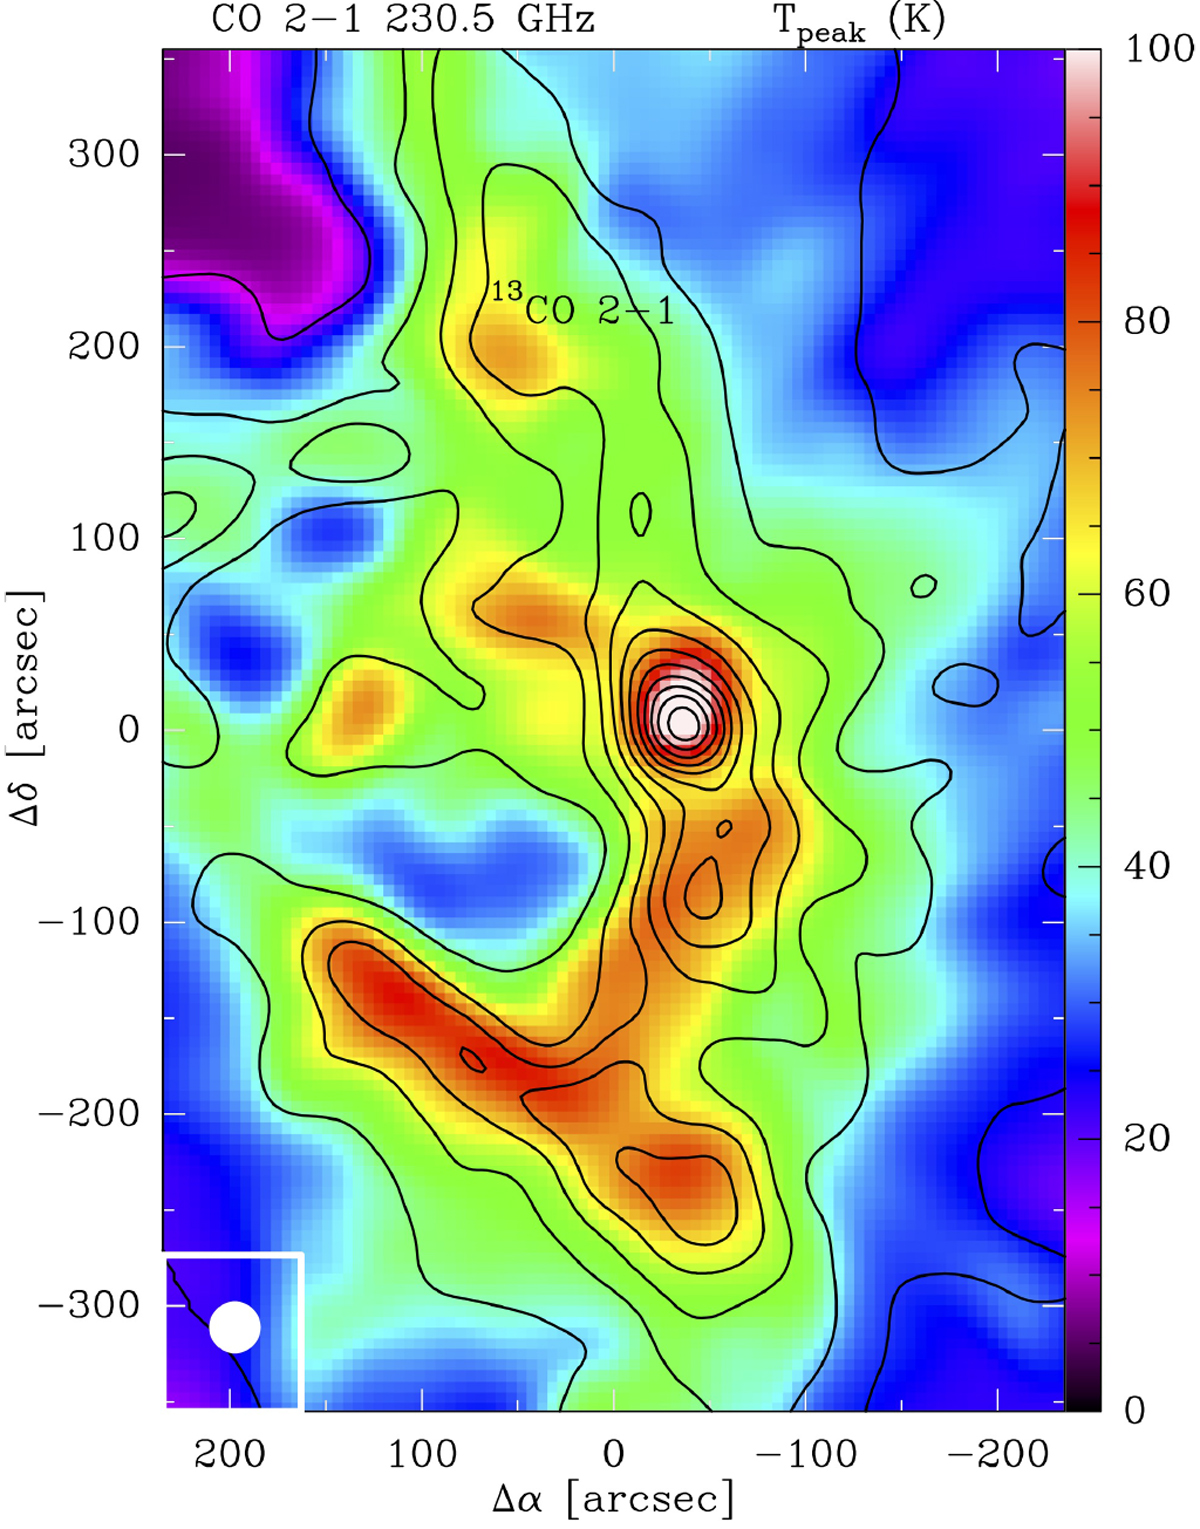
Map of the CO J = 2–1 line intensitypeak (Tpeak in K; shown in color scale). Because the CO J = 2–1 emission is optically thick in most of the field, this map provides a lower limit to the gas temperature in the layers where the line emission arises, that is, Tpeak ≃Trot (CO 2–1) ≤Tk.
Current usage metrics show cumulative count of Article Views (full-text article views including HTML views, PDF and ePub downloads, according to the available data) and Abstracts Views on Vision4Press platform.
Data correspond to usage on the plateform after 2015. The current usage metrics is available 48-96 hours after online publication and is updated daily on week days.
Initial download of the metrics may take a while.