Free Access
Fig. B.4
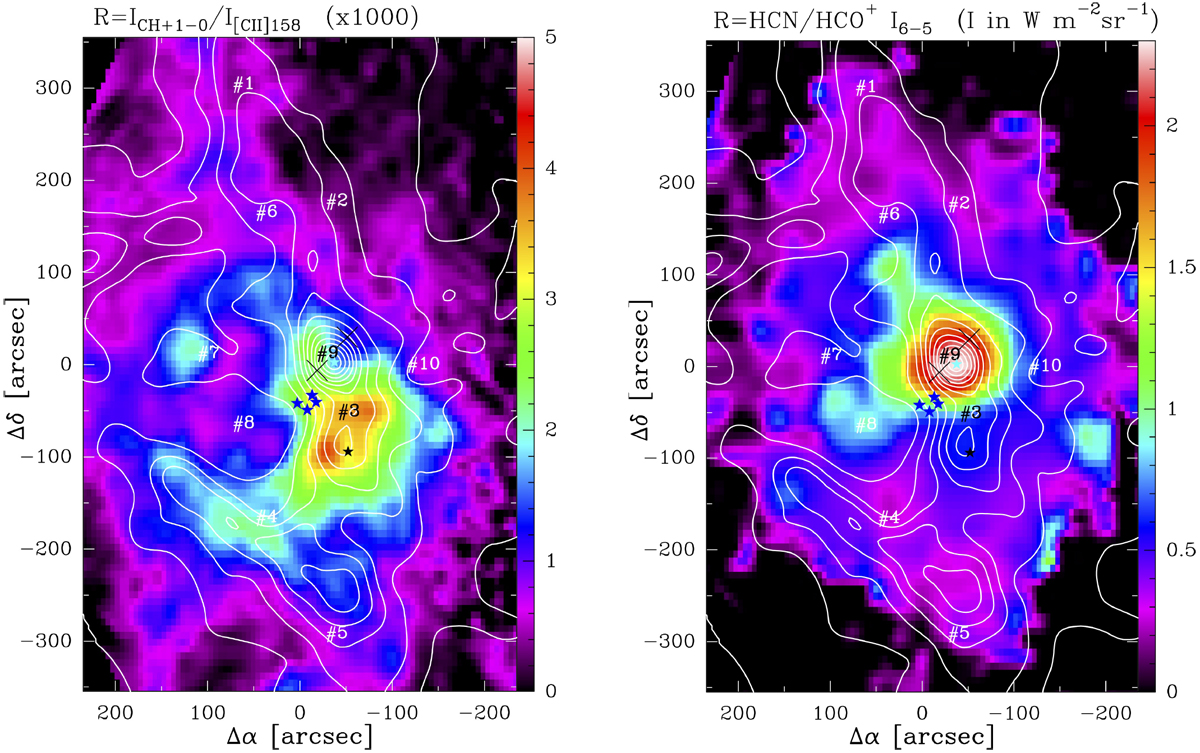
Leftpanel: map of the CH+ J = 1–0 to [C II] 158 μm line intensityratio (in units of W m−2 sr−1) roughly proportional to gas density variations at the irradiated cloud surfaces. Right panel: map of the HCN J = 6–5 to HCO+ J = 6–5 line intensityratio. In both maps contours represent the 13CO J = 2–1 optically thin emission.
Current usage metrics show cumulative count of Article Views (full-text article views including HTML views, PDF and ePub downloads, according to the available data) and Abstracts Views on Vision4Press platform.
Data correspond to usage on the plateform after 2015. The current usage metrics is available 48-96 hours after online publication and is updated daily on week days.
Initial download of the metrics may take a while.